Welcome to my West Greenland Salmon Sampling photo blog
My name is Sean Dugan and I am based at the Marine Scotland Freshwater Fisheries Laboratory near Pitlochry. I am employed by Fisheries Management Scotland with joint funding from Marine Scotland, SEPA and the fisheries trusts and boards. My role involves providing support to local fisheries managers in Scotland in terms of data collection, data storage, training and mapping services. I am responsible for facilitating the sharing of data between Fisheries Trusts, Marine Scotland and SEPA. My role also involves working with Marine Scotland to support Fisheries Management Planning and salmon Conservation Regulations. Marine Scotland fund expenses on the trip and my time is covered by a combination of annual leave and Fisheries Management Scotland.

You can keep up with my Greenland Flickr photostream here
BLOG 5
Passport control
New genetic analysis reveals the identity of salmon migrating to Greenland
Background
In my final blog we look at the key findings from the most recently published genetic analysis of West Greenland salmon samples. The reason for carrying out these studies is that an understanding of the origin of salmon taken by the West Greenland fishery is required in order to quantify the impact of this fishery at a local, regional, national or even continental scale. In theory, future conservation efforts can then be directed at populations under particular threat.
Since salmon were first discovered at West Greenland in the early 20th Century scientists have been trying to understand their origin. A range of techniques have been deployed with physical tagging or “marking” being the only conclusive method. Fish size and shape variations, scale reading and otolith analysis have also been used at a coarse scale to estimate whether the fish are of European or North American origin.
Brabury et al. (2016)
Using a dataset of 2169 fish caught off Greenland between 2011 and 2014, scientists from 6 institutions in Canada and U.S.A. used genetic analysis to assign 22% of fish to Europe, 20% to Labrador, 29% to Southern Gulf/Cape Breton (Nova Scotia), and 29% to Gaspe Peninsula (Quebec). Inclusion of historic data such as archived scale samples from 1968-1998 show that the proportion of European fish contributing to the fishery has remained relatively stable since the late 1980’s.
Between the 60’s and the late 90’s analysis was predominantly based on the reading of scale characteristics. North American contributions are thought to have increased from around 33% in 1960 to approximately 75% since the 1990’s. Recent genetic data show a 77-82% North American contribution. Interestingly, genetic results suggest that in any year up to 1 in 5 salmon were wrongly assigned by scale readers. Reading of scales from tagged fish of known origin is also thought to carry an error of 1 in 10 fish.
Detailed analysis of individual net landings at Greenland in the 70’s led to the thinking that fish from Europe group together during their Greenland migration, leading to the assumption that European and North American fish do not mix. However, recent genetic studies suggest that fish from both continents mix significantly and are caught together in the same net.
Jeffery et al. (2018)
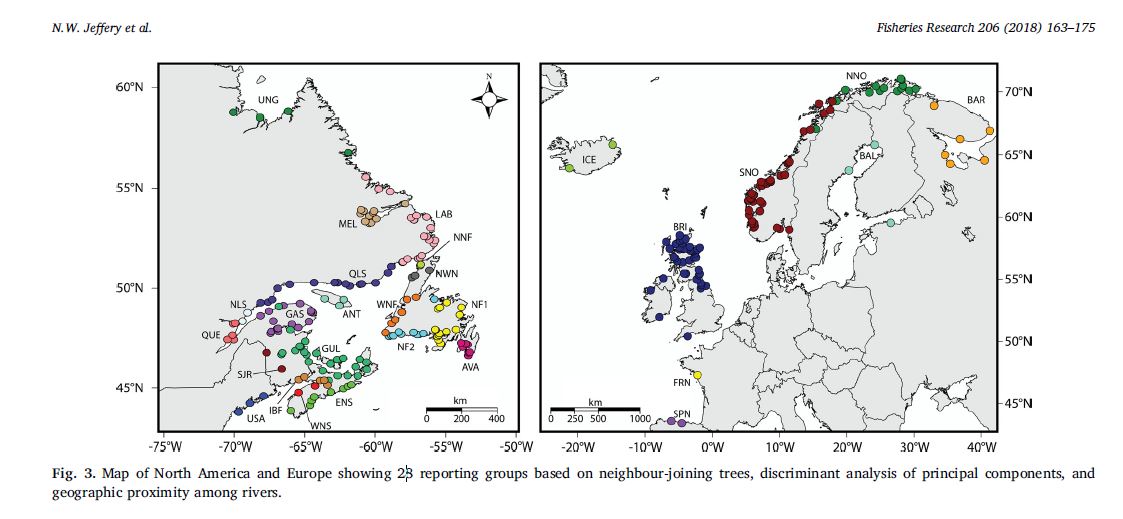
More recently, a collaboration between 10 institutions (including the Marine Scotland Freshwater Fisheries Laboratory) expanded upon Bradbury et al. (2016) to identify 28 genetically distinct population groupings across the North Atlantic. These included 20 North American groupings and 8 European groupings, with the UK as one single group.
From a sample of catches from West Greenland the majority of the European samples were assigned to the UK. Of the North American fish, the predominant populations were Gulf of St Lawrence (28%), Gaspe Peninsula (23%) and Coastal Labrador (21%). Overall, the West Greenland fishery catch is estimated at approximately 80% North American and 20% European.
Further work is needed as assignments to Spain, France and Southern Norway have high uncertainty and indeed the UK contribution to the fishery could be higher than estimated. A very small proportion of fish were thought to be from northern Europe, a population that feeds predominantly in the Norwegian Sea and near the Faroe Islands.
Sources:
BLOG 4
Finding the needle in the haystack
40 years of tagging salmon in freshwater and recovering tags in West Greenland reveals the species’ oceanic migrations
Welcome to the 4th in my series of 5 blogs revealing data and insights from the West Greenland Atlantic salmon fishery.
History
Tagging or “marking” animals has long been used to develop our understanding of species distributions and migrations. The first record of a juvenile salmon being marked in Scotland was by Brown (1862) on the River Tay. The first ever recorded Scottish tag recovery from Greenland was from a mature adult salmon caught and tagged on the Blackwater River, a tributary of the Conon in autumn 1955. This fish was then captured in Eqaluq Fjord, West Greenland on October 15th 1956.
By coincidence 61 years and 11 months later I visited the same area to sample salmon. This data represented a great advance in the understanding of the salmon’s marine life cycle as it was one of the longest recorded migrations and almost nothing was known about the salmon’s ocean migrations at that time.
Background
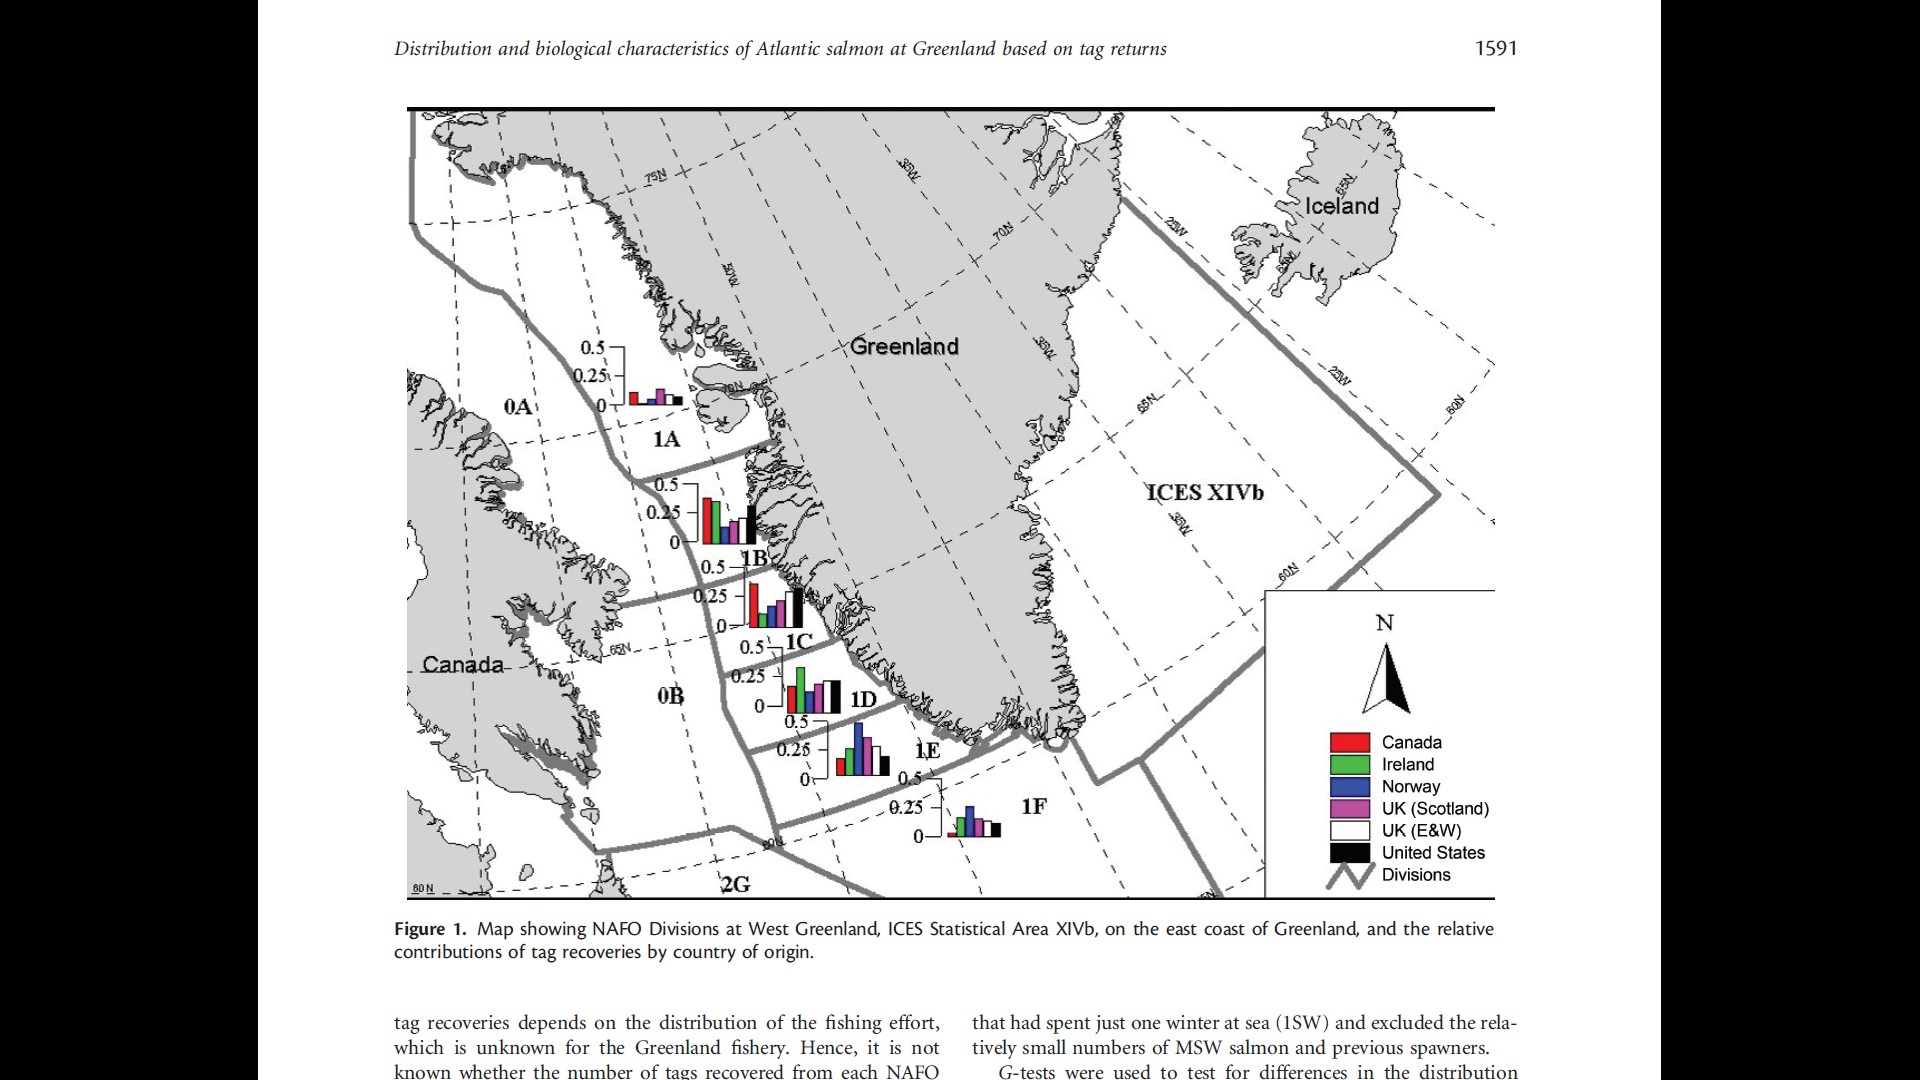
In the present day technology has evolved to the extent that satellite tags can be attached to salmon revealing complex data on their movements, feeding behaviour and local environmental conditions. Tagging salmon as juveniles in the 1960’s before recovering these tags at Greenland revealed the species oceanic migrations for the first time. Tagging of fish as juveniles in freshwater has continued since the 1960’s and in 2012 a collaboration between authors from 12 different institutions published analysis of all West Greenland tag recoveries. This work is based on the International Council for the Exploration of the Seas (ICES) database of 5481 individual salmon recoveries and represents the return from several million tagged fish releases across the North Atlantic countries.
Key findings
- Salmon from Canada, U.S.A, France, Faroes, Greenland, Iceland, Ireland, Norway, Spain and all parts of the UK are recovered at Greenland.
- All fish recovered at Greenland have already spent 1 winter at sea meaning that they are destined to return to freshwater as multi-sea-winter fish.
- Limited recoveries from East Greenland suggest that salmon from northern Europe (Norway, Sweden and Russia) are more likely to be found in East Greenland than southern European fish (Scotland south to Spain).
- In West Greenland North American fish are more likely to be found in northern locations (including my sampling region of Maniitsoq) than southern European fish.
- In southern Greenland, samplers were almost twice as likely to find European fish as in more northerly sampling locations.
- Tag recovery rates were similar before and after the introduction of a North Atlantic Salmon Conservation Organisation (NASCO) tag reward scheme in 1989. Fisherman recovering tags are entered into a lottery giving them the chance to win up to £2000.
Scottish salmon records from Greenland
Focusing on our “tartan” salmon, a total of 273 tags from Scottish fish were recovered between 1973 and 2008, the highest number for an individual country behind U.S.A (2128) and Canada (1814). Over the entire period 0.026 Scottish tags were recovered for every tonne of salmon reportedly landed in Greenland. To understand how small the chances of recovering a Scottish tag are, if you take the average weight of a salmon caught off Greenland in 2017 (3.31kgs), a tonne equates to around 300 fish. On average one must sample 11,620 individual salmon to find a Scottish tag. Further, the vast majority of Scottish fish that migrate to Greenland are never caught so have no chance of being sampled. Data from ICES estimate that the exploitation rate peaked at 1 in every 3 European fish in 1975 with the exploitation rate now around 0.8%. Therefore, my chances of finding a Scottish tag were rather low indeed.
Tagging reveals long-distance migrations
In 1984 scientists used tagging data to prove that a small number of salmon migrate all the way from Europe to the coast of the U.S.A. and vice versa. However, Greenlandic waters are thought to be the only area where European and North American fish migrate to feed together in significant numbers.

Long-term changes in size and weight of salmon at Greenland
Based on tagging data, the mean length of European salmon (currently 61.7cm) has reduced slightly since 1960 whereas it increased for North American fish. Interestingly, the mean weight did not change for either group. According to tag recoveries there is no evidence that North American fish arrive at West Greenland before European fish. European fish are thought to take a less direct route, first heading north to the Norwegian Sea during their first summer at sea before heading west to Greenland.
ICES release comprehensive new report
At the time of writing a comprehensive new report has been published by ICES entitled “Fifty years of marine tag recoveries from Atlantic salmon”. Since 1968, a total of 403 recoveries of Scottish tagged fish have been made along the Greenland coast. These fish were released as juveniles from a total of 10 locations in Scotland including the Isle of Mull, Aberdeenshire Dee tributaries (Girnock and Baddoch), North Esk and River Tay. Since the 1990’s tagging of salmon in Scotland with external and coded wire tags has considerably reduced, with no recoveries recorded since 2006.
Source: Ó Maoiléidigh et al. (2018)
Future Research
Scientists and managers at annual NASCO meetings repeatedly call for a more precise understanding of the composition of the fishery at Greenland. In particular, more precise data on catches in space and time are required. It is anticipated that this level of understanding may be utilised in future to implement regional catch limits to protect threatened salmon populations. At the time of writing the Atlantic Salmon Federation are catching salmon in South West Greenland and attaching satellite pop-up tags to reveal their migration behaviour during winter feeding and return to home waters. These tags will record data continuously until 1st May 2019 when they will pop off and transmit data.
Satellite tracking technology is advancing rapidly and could be utilised further to track the movements of fish and fisherman at West Greenland. For example, fisherman could be issued with GPS devices allowing them to send a location when they deploy nets and a record of catches remotely. For example this type of monitoring will shortly be implemented in Scottish inshore waters to vessels under 12m in length as part of a £1.5million investment announced by Scottish Government.
As genetic technology advances historical archived data collected since 1960 could yet yield further insight as new genetic techniques can extract information from preserved fish scales.
In the Pacific Northwest commercial catches of salmon at sea are managed using state-of-the-art real-time genetic analysis. Catches are analysed daily on-board fishing vessels and if fish from a river under threat are caught the fishery is put on hold in that area for a period of time. As far as I am aware this type of approach is not on the table for application in Greenland. Besides the socio-economic interests of the Greenlandic people, salmon from different regions are thought to mix significantly off the West Greenland coast so this type of approach may or may not be feasible.
Sources:
Brown, W. (1862) Natural History of the Salmon, Recent Experiments, Artificial Spawning and Hatching of the Ova and Rearing of the Fry at Stormontfield, on the Tay.
Menzies, W.J.M & Shearer W.M. (1957) Long-distance Migration of Salmon. Reprinted from nature Vol 179 p. 790 April 13 1957.
Ó Maoiléidigh, N., White, J., Hansen, L. P., Jacobsen, J. A., Potter, T., Russell, I., Reddin,
D., et al. 2018. Fifty years of marine tag recoveries from Atlantic salmon. ICES Cooperative
Research Report No. 343. 121 pp. http://doi.org/10.17895/ices.pub.4542
Reddin et al. (1984). Inter-continental migrations of Atlantic salmon (Salmo salar L.). ICES Document CM 1984/M: 11. 9 pp.
BLOG 3
Recent data from the West Greenland fishery
In my 2nd blog I summarised how the West Greenland Fishery has been managed through time up until the latest advice and subsequent agreement reached in June 2018 covering the 2018, 2019 and 2020 fishing seasons. In this blog we look in more detail at the latest available data on catches from the 2016 and 2017 fishing seasons. Analysis by ICES also provides an estimate of exploitation rate, the percentage of salmon from different populations taken at Greenland. Key statistics on the salmon sampled by the international sampling teams are also provided directly from the latest available report with a focus on European fish.

Key statistics reported by ICES to NASCO
- A total catch of 28.0t (approximately 7,800 fish) was reported for 2017 compared with 27.1t (approximately 7500 fish) in 2016.
- In 2017 15.3t was reported as commercial catch and 12.7t private.
- 1% of this catch was reported from East Greenland.
- 89% of the catch was from licensed fishers and 11% from unlicensed fishers.
- There is currently no quantitative method for estimating un-reported catches but 10t is applied annually as reported by Greenlandic authorities.
- Data from international sampling teams is also used to identify un-reported catch.
- Seasonal distribution of catches is thought to generally reflect early catches in southern regions and later catches in northern regions.
- 282 fishing licenses were issued with 143 of these fishers providing reports in 2016 and 2017.
- Fishers are required to report catches to the Greenlandic Government on a daily basis by phone or email.
Exploitation rate
Exploitation rates for specific stocks are derived by ICES by dividing the estimated reported catch at West Greenland by the pre-fishery abundance estimate for the corresponding year for each salmon population. The most recent exploitation estimates for North American stocks -the 2016 season- are 5.4% (previous 5 year mean, 9.2%). To put this in historical context exploitation is thought to have peaked in 1971 at around 41%. Exploitation of southern European fish (including those from Scotland) in 2016 was 0.8% (previous 5 year average of 0.6%). European stock exploitation is thought to have peaked in 1975 at an estimated 33.6%.
International sampling programme key statistics
In 2017 1516 salmon were observed by sampling teams, approximately 20% of the total reported. 23 adipose-clipped fish were found with tags from Ireland (2), USA (2), and Canada (5). In 2017 ICES estimated that of the reported catch, 6100 were North American (74%) and 2200 European (26%). The mean length of European fish was 64.8cm and mean weight 3.31kgs. European fish were predominantly river age 2 (73%) and 3 (15.4%) with 93% of European fish having spent 1 winter at sea at the point of sampling. The remaining 7% of fish had already spent 2 or 3 years at sea meaning that they were destined to return to freshwater as large 3 or 4 sea winter salmon. Although Greenland has a natural wild salmon producing river called “Kapisillit River” very few Greenlandic fish are recorded.

Source:
BLOG 2
Made in Scotland – matured in Greenland
How is the West Greenland fishery managed?
Background
Welcome to the 2nd in my series of 5 blogs about the West Greenland Atlantic salmon fishery. In addition to these science-based articles you can also view my photostream. Between August 30th and September 17th 2018 I travelled to Maniitsoq, West Greenland to collect samples from the Inuit salmon fishery to feed in to an International Council for the Exploration of the Sea’s (ICES) research programme.
As mentioned in my first blog the salmon fishery began in the early 1960’s and quickly rose to a peak of over 2700t in 1971 (potentially up to 1 million individual fish). Here is a brief chronology of key stages in the evolution of the fishery:
| 1976 | International vessels banned and the catch by Greenlandic vessels limited to 1190t. |
| 1983 | North Atlantic Salmon Conservation Organisation (NASCO) was created to “conserve, restore, enhance and rationally manage wild Atlantic salmon”. |
| 1980’s | Catch reduced to less than 800t. |
| 1985 | Minimum gillnet mesh size of 140mm introduced to limiting the capture of small salmon. |
| 1998 | With the exception of 2001, the export of salmon from Greenland was banned. |
| 2002-2017 | Fishery restricted to an internal-use fishery of <50t annually. |
| 2018-2020 | Quota reduced to 30t (approx. 9000 individual fish) for internal use only. Salmon can only be caught for private subsistence consumption or be sold at local fish markets. Salmon cannot be sold directly to fish processing factories or hotels and businesses. |
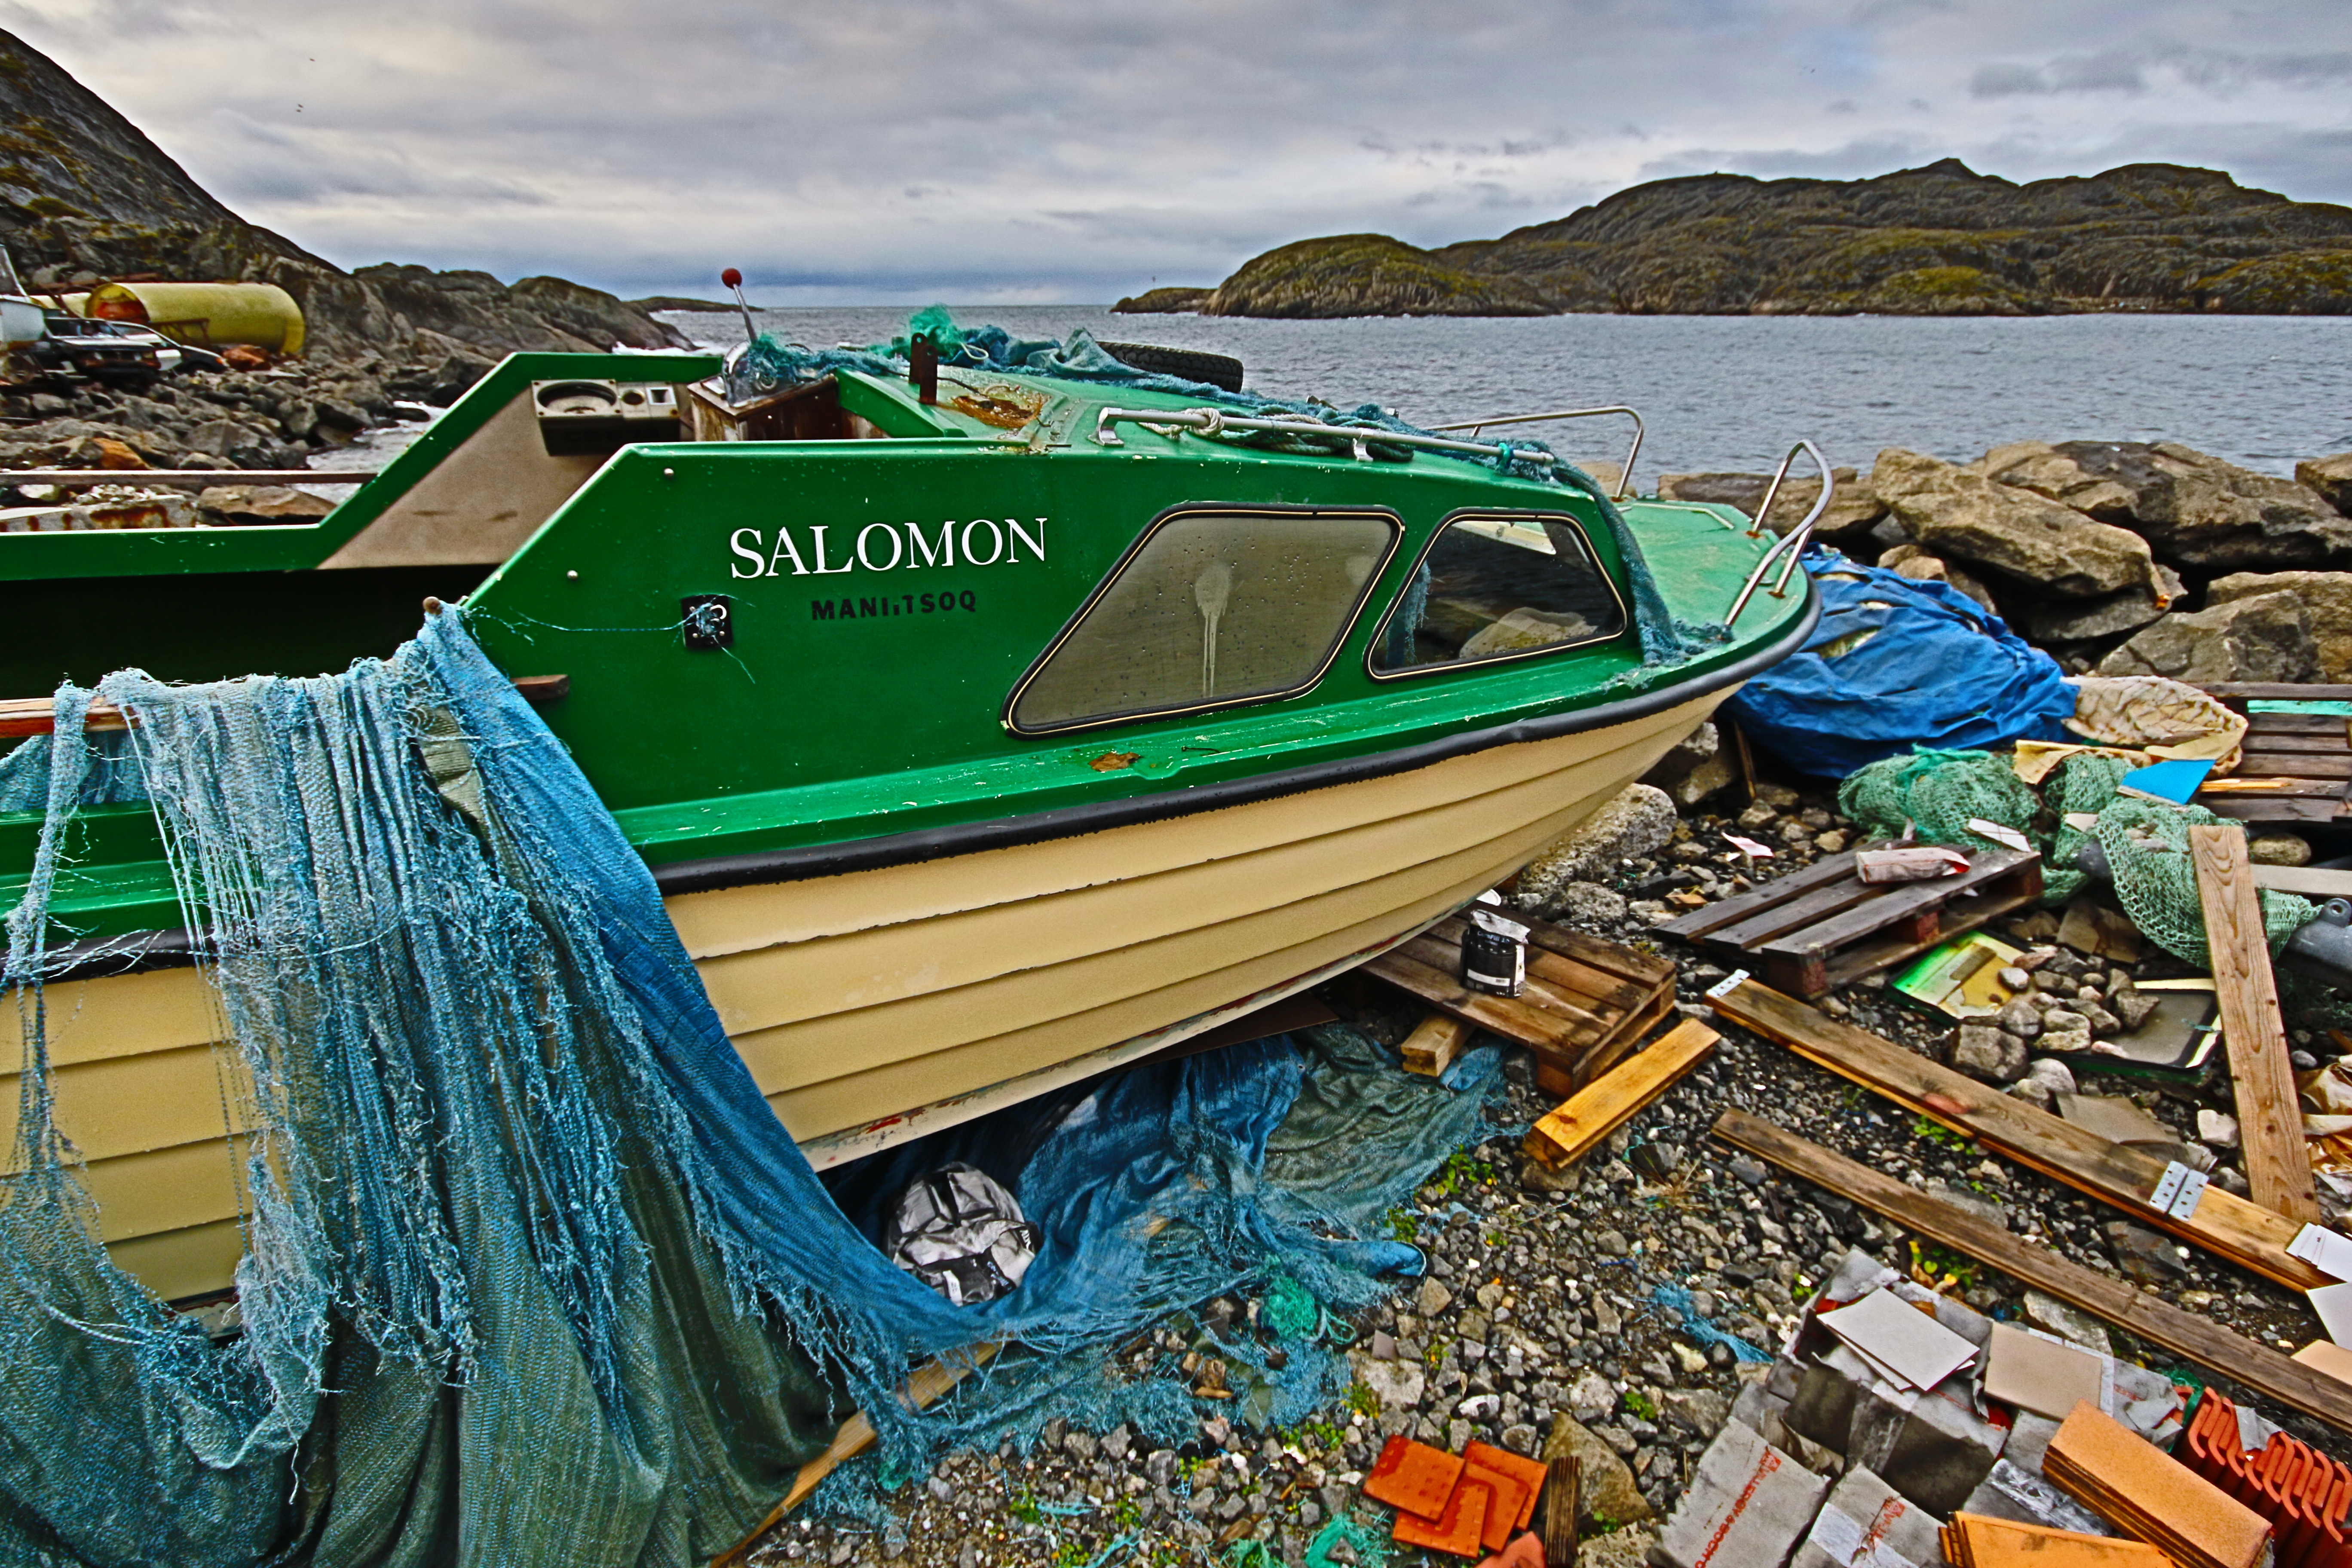
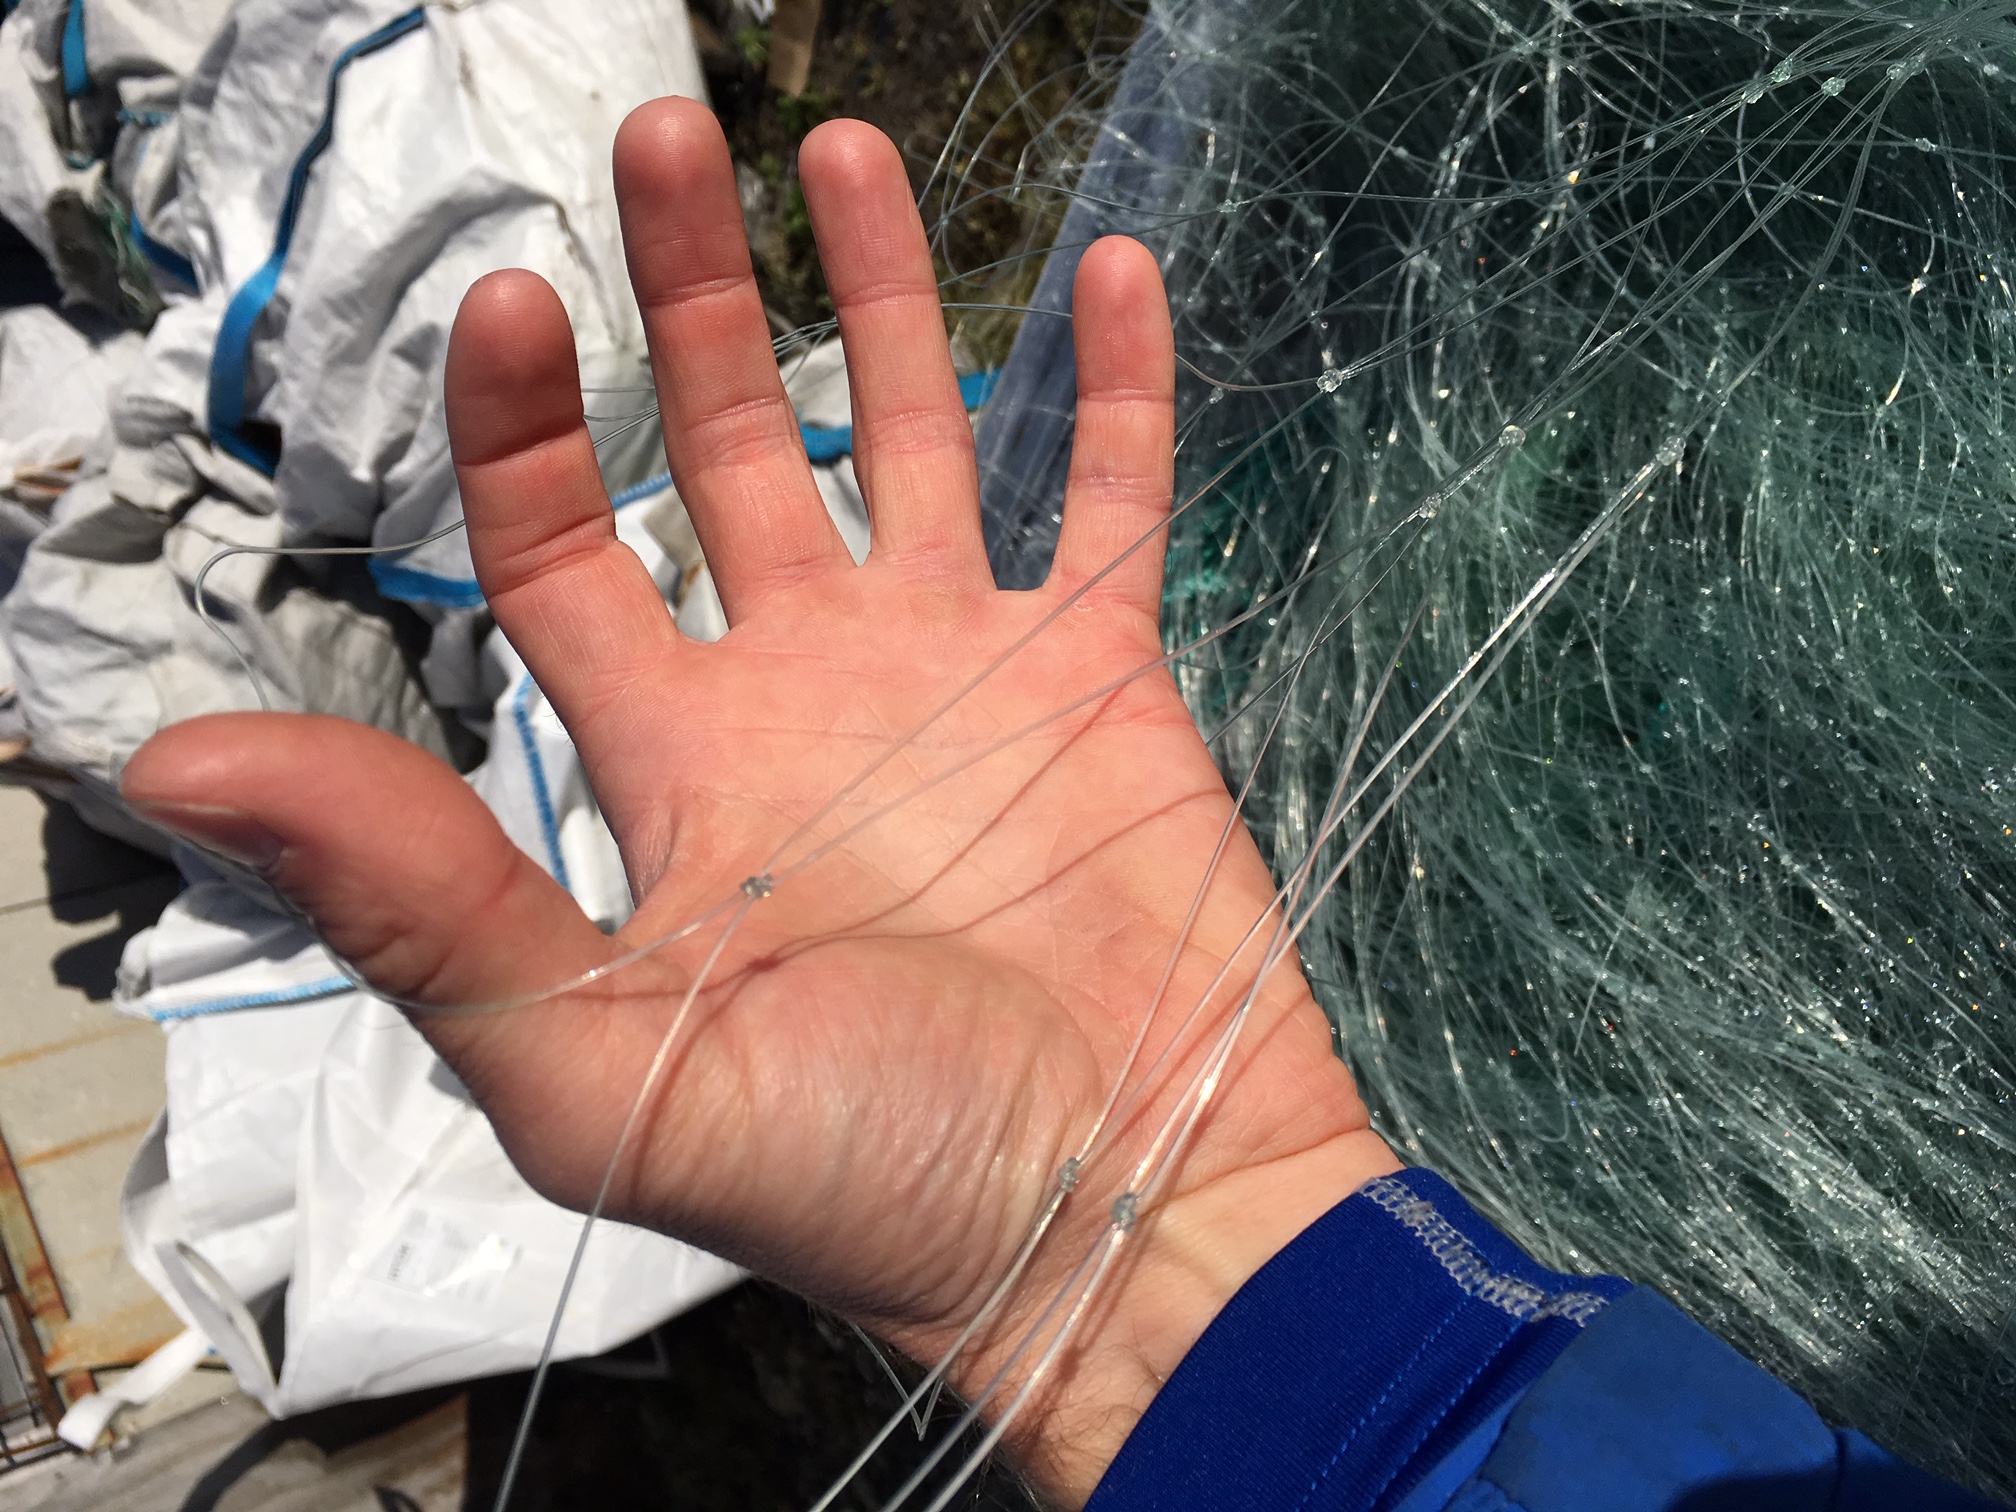
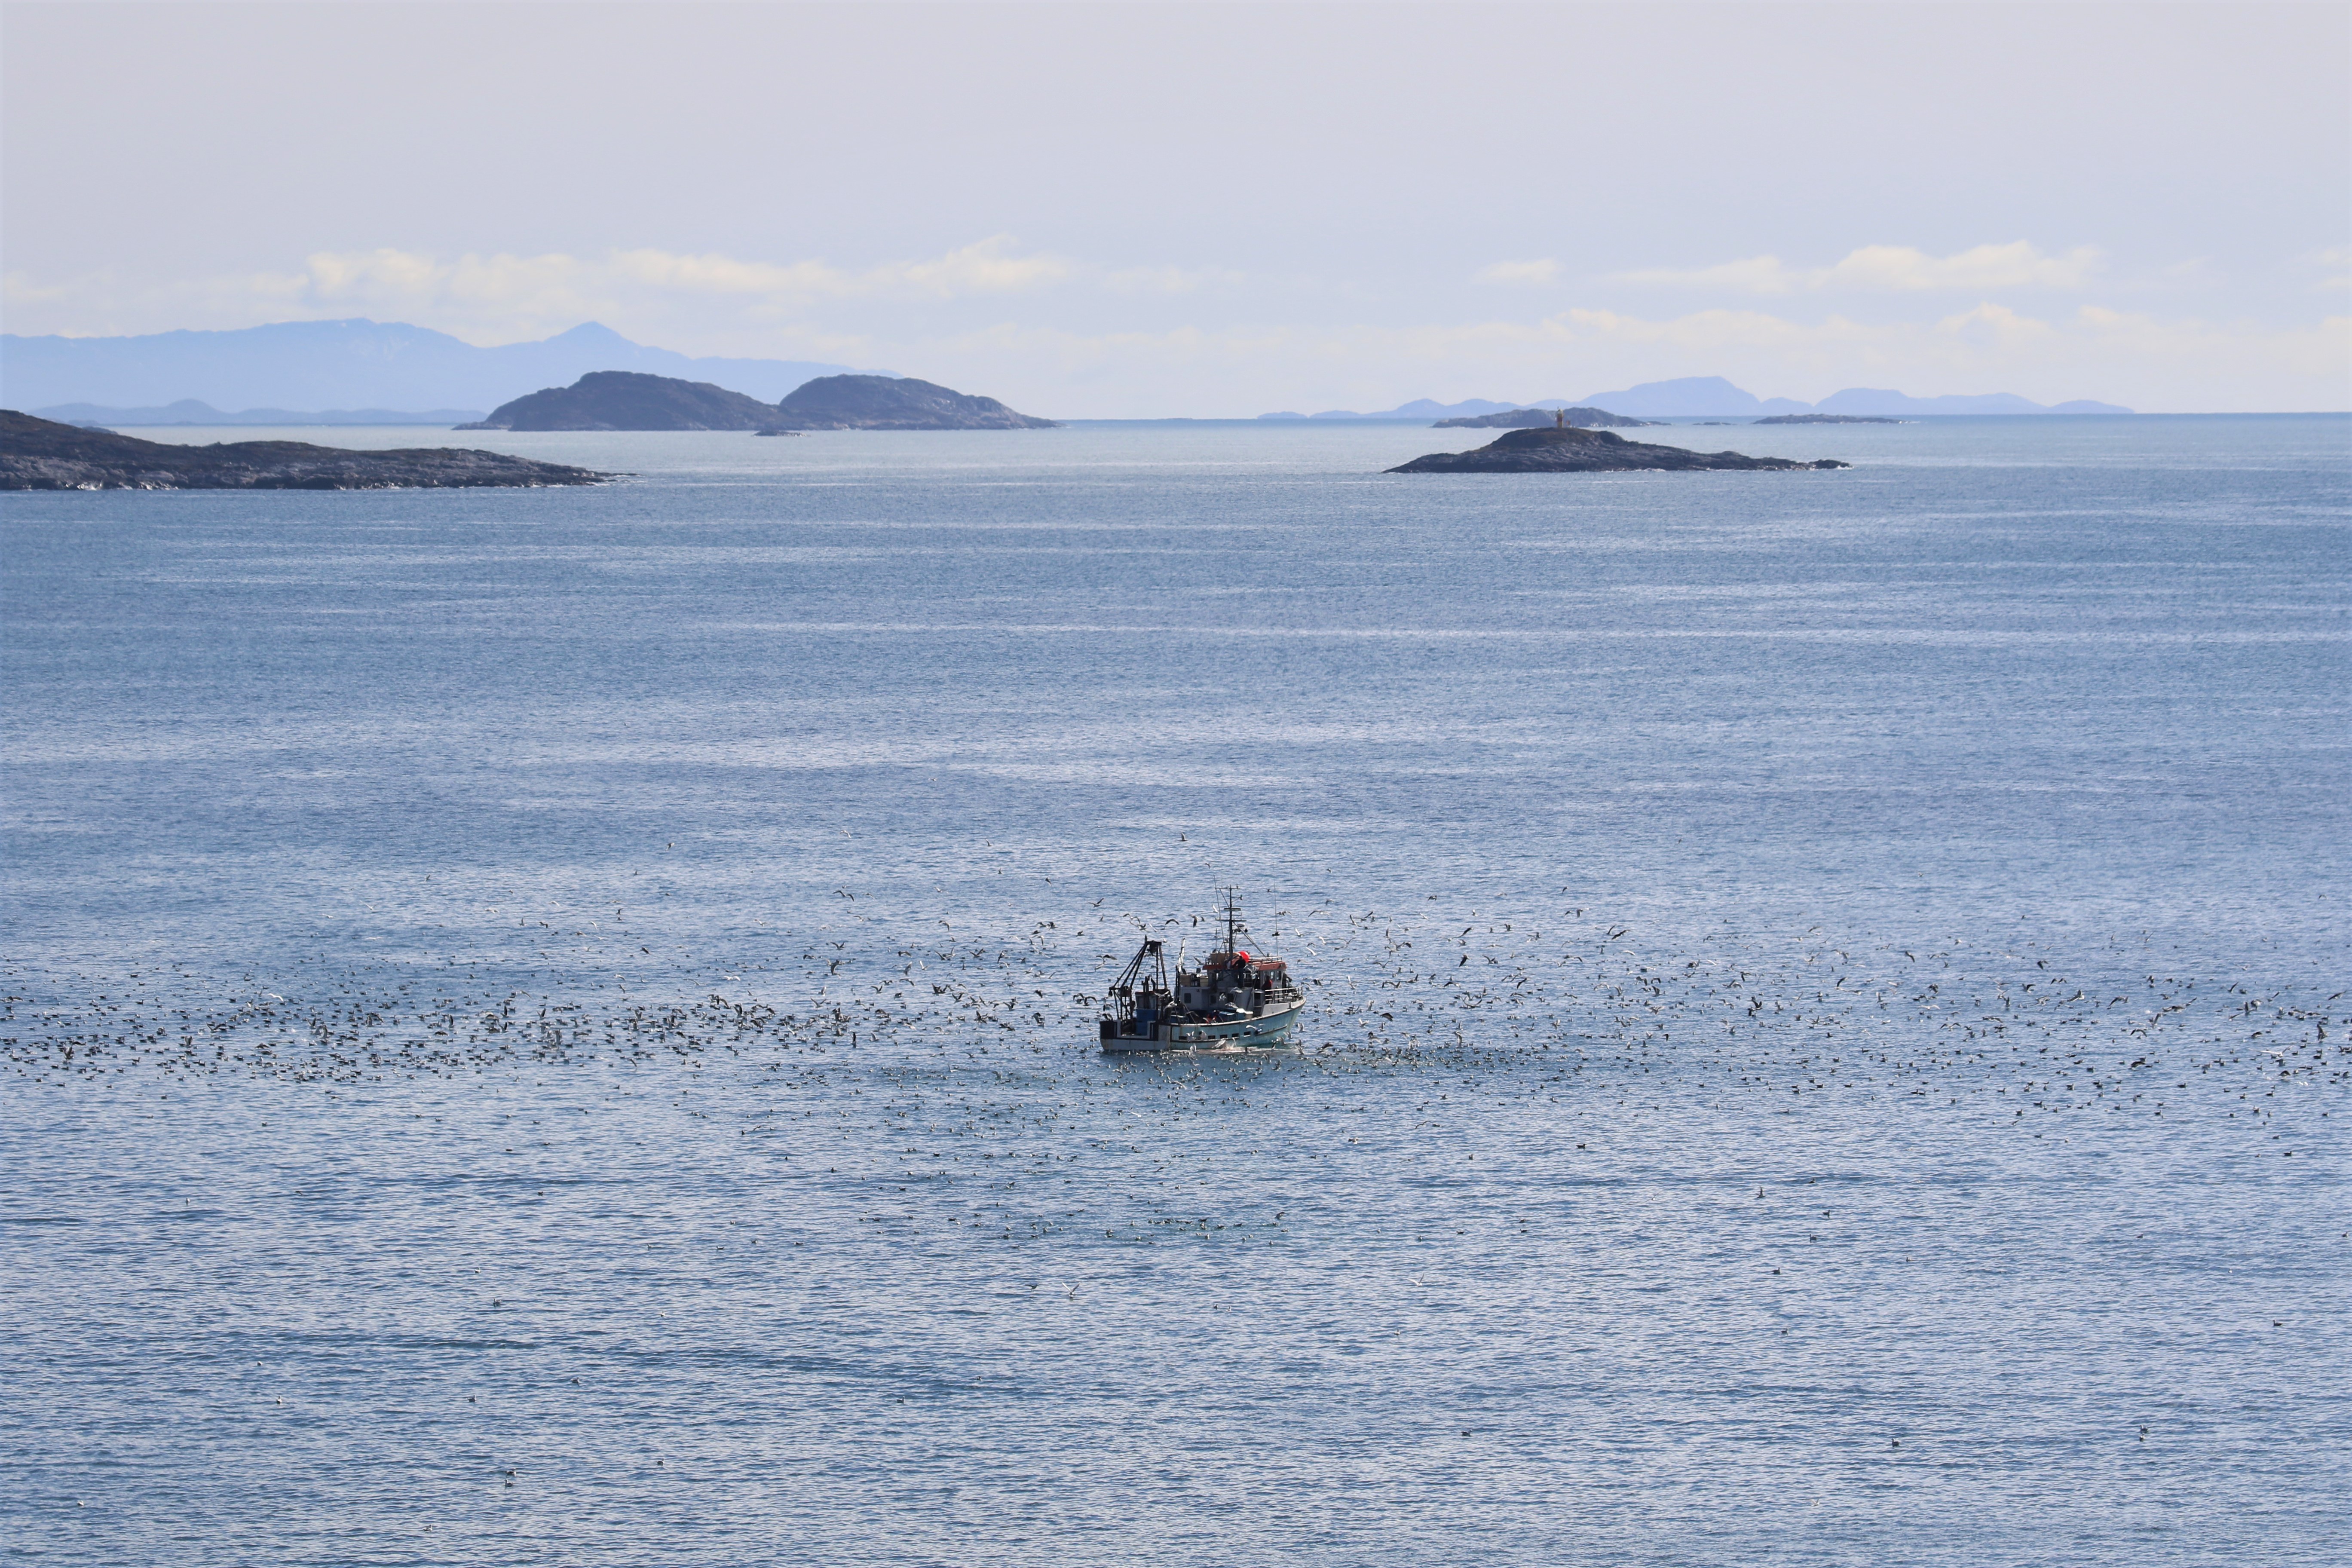
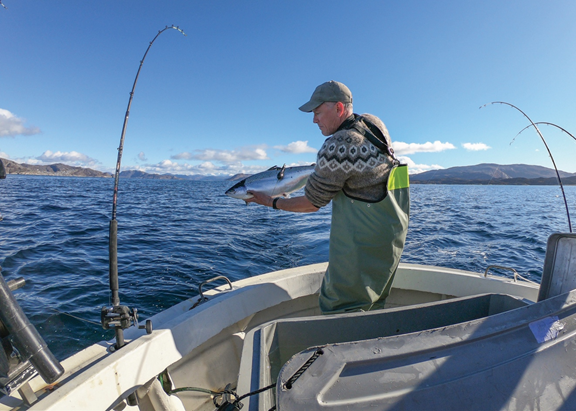
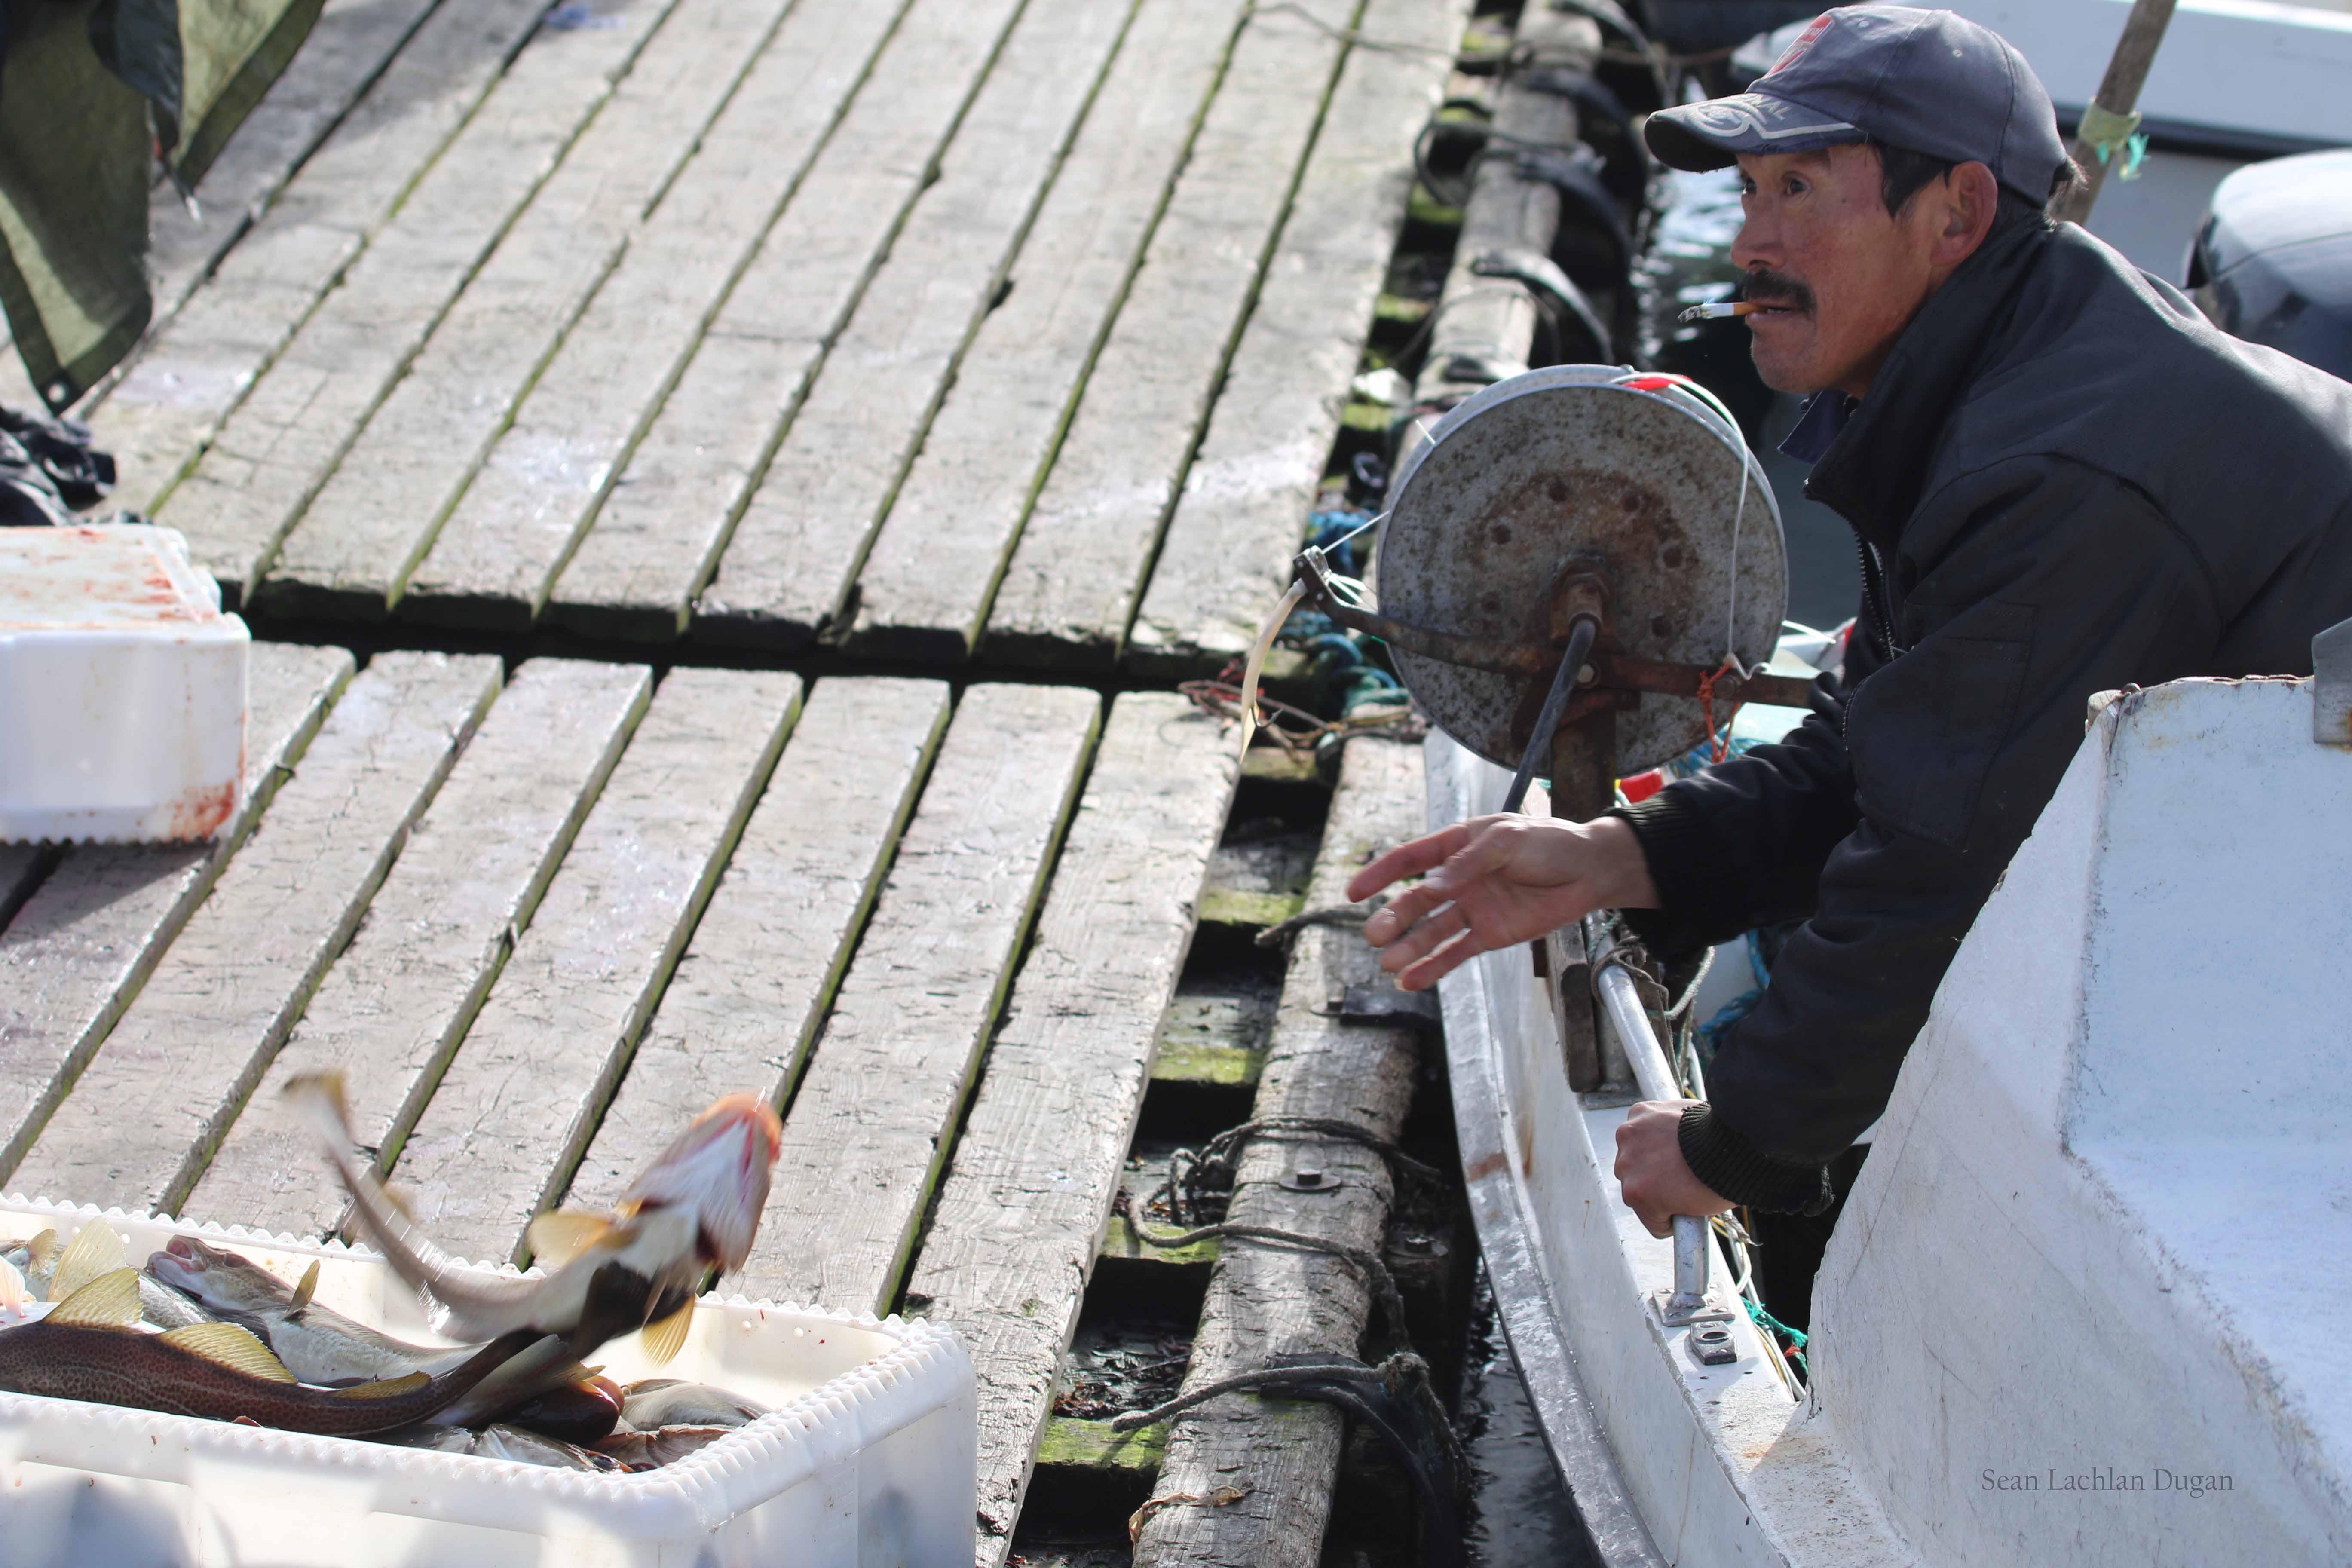
While fishing was carried out by large international ocean-going vessels in the 60’s and 70’s, it is now fished by local Greenlandic people close to shore from small boats. Only hook, fixed gillnets and driftnets are allowed to target salmon. Fishing seasons vary from year to year, but generally start in mid-August and continue until the end of October.
By the time the fishery commences the salmon caught have spent at least 1 winter at sea. Therefore, the West Greenland fishery takes large salmon that are destined to spend at least 2 winters feeding at sea. Salmon that have previously spawned are thought to make up less than 5% of the fishery.
How is the fishery managed?
NASCO representatives from across the North Atlantic countries meet annually in June to discuss a range of issues related to the conservation and management of Atlantic salmon. As part of this week-long meeting NASCO request management advice from the International Council for the Exploration of the Seas (ICES) on the West Greenland fishery. As the fishery targets salmon from a vast range of different populations ICES make it clear that the mixed stock nature of the fishery is against the principal of managing species as distinct populations.
ICES advice is based on collation and analysis of the latest available data provided by the Government of Greenland and by the international team of samplers. Inuit fisherman are required to submit catches daily to the Government of Greenland for collation and reporting to ICES. Following annual debate at the NASCO meeting and agreement by stakeholders management measures are announced. The role of regulating the fishery on the ground is then held directly by the Government of Greenland.
Management recommendations provided by ICES in June 2018
- A maximum of 30t of salmon to be landed in 2018.
- Only 2 types of landings permitted:
- “Local market landings” where licensed fishers can sell to local markets.
- “Private landings” where licensed and unlicensed fishers can land for private subsistence consumption.
- ICES also provided specific advice for the following 7 broad salmon populations; Labrador, Newfoundland, Quebec, Gulf of St Lawrence, Scotia-Fundy, U.S.A and Southern North East Atlantic (including Scotland). Out of these 7, 5 are currently thought to be below good conservation status. The Southern North East Atlantic stock is currently thought to be above its conservation limit. However, the probability of meeting good conservation status for this stock is forecast at 0.377, 0.421 and 0.549 respectively for the 2018-2020 period.
- There is a very low probability of meeting conservation objectives for Canada (2018-2020- 0.087-0.194) and USA (0.000 -0.003) even if no West Greenland fishery took place.
- ICES also noted that as fish grow rapidly during the August-October fishing season, in future weight-based quotas that encourage later fishing could result in a reduced total number of fish being taken and a commensurate reduction in exploitation rate.
Source:
ICES. 2018. Revised Report of the ICES advisory Committee Council CNL (18) 08rev, 9th May 2018.
BLOG 1
Wild Atlantic salmon
Scotland’s wild Atlantic salmon fishery generates over £100 million per year for the rural economy. Populations across the North Atlantic have declined in recent years despite reductions in exploitation and many other freshwater conservation efforts. Atlantic salmon have an anadromous life cycle meaning that they migrate from salt water up rivers to spawn. After hatching juveniles usually spend between 1 and 3 years in freshwater before migrating to sea. Salmon feed across the North Atlantic and travel as far as West Greenland. After a year or more at sea salmon return to the river of their birth to continue their life cycle.
The likelihood of salmon surviving their marine migration has declined in recent decades to a situation where less than 5 out of every 100 salmon leaving the Scottish coast return safely. This decline has prompted international research efforts including the West Greenland Salmon Sampling Programme.
History of West Greenland sampling
In the 60’s and 70’s the West Greenland salmon fishery involved vessels from numerous countries intercepting fish originating from North America, continental Europe, Iceland and Greenland. At the height of the Fishery in the early 70’s up to 2700 tonnes of salmon were caught. Many of the salmon populations from the natal rivers have experienced large declines and some are now facing extinction. Scientists have sampled salmon in West Greenland since the 1960’s with an increased co-ordinated effort since 2002. Since then, Scottish Government have contributed to this sampling effort by funding a Scottish sampler each year.
4 regions in Greenland will be sampled in 2018 by samplers from several North Atlantic countries, co-ordinated by Tim Sheehan of NOAA in Massachusetts.
WHY sample?
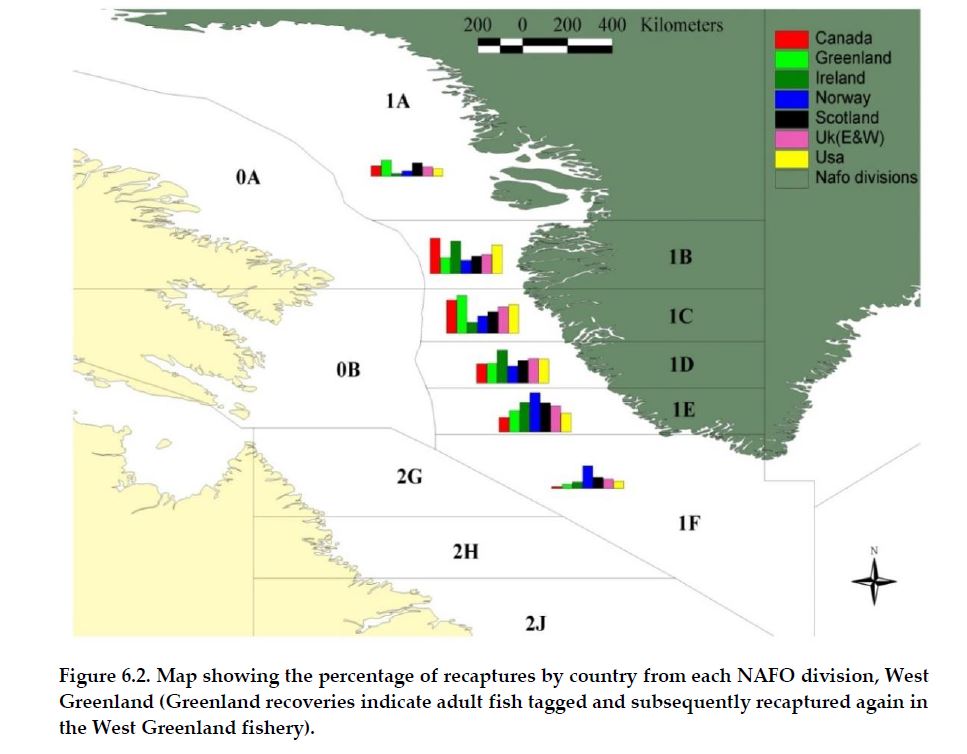
Information collected is used by the International Council for the Exploration of the Seas’ (ICES) to provide catch advice to the North Atlantic Salmon Conservation Organisation (NASCO) including the composition of the mixed stock fishery and region of origin (see map below). NASCO is an international organisation, established by an inter-governmental Convention in 1984, to conserve, restore, enhance and rationally manage Atlantic salmon through international cooperation taking account of the best available scientific information. Sample data is also used to account for under-reporting of catches if samplers record more fish than are reported.
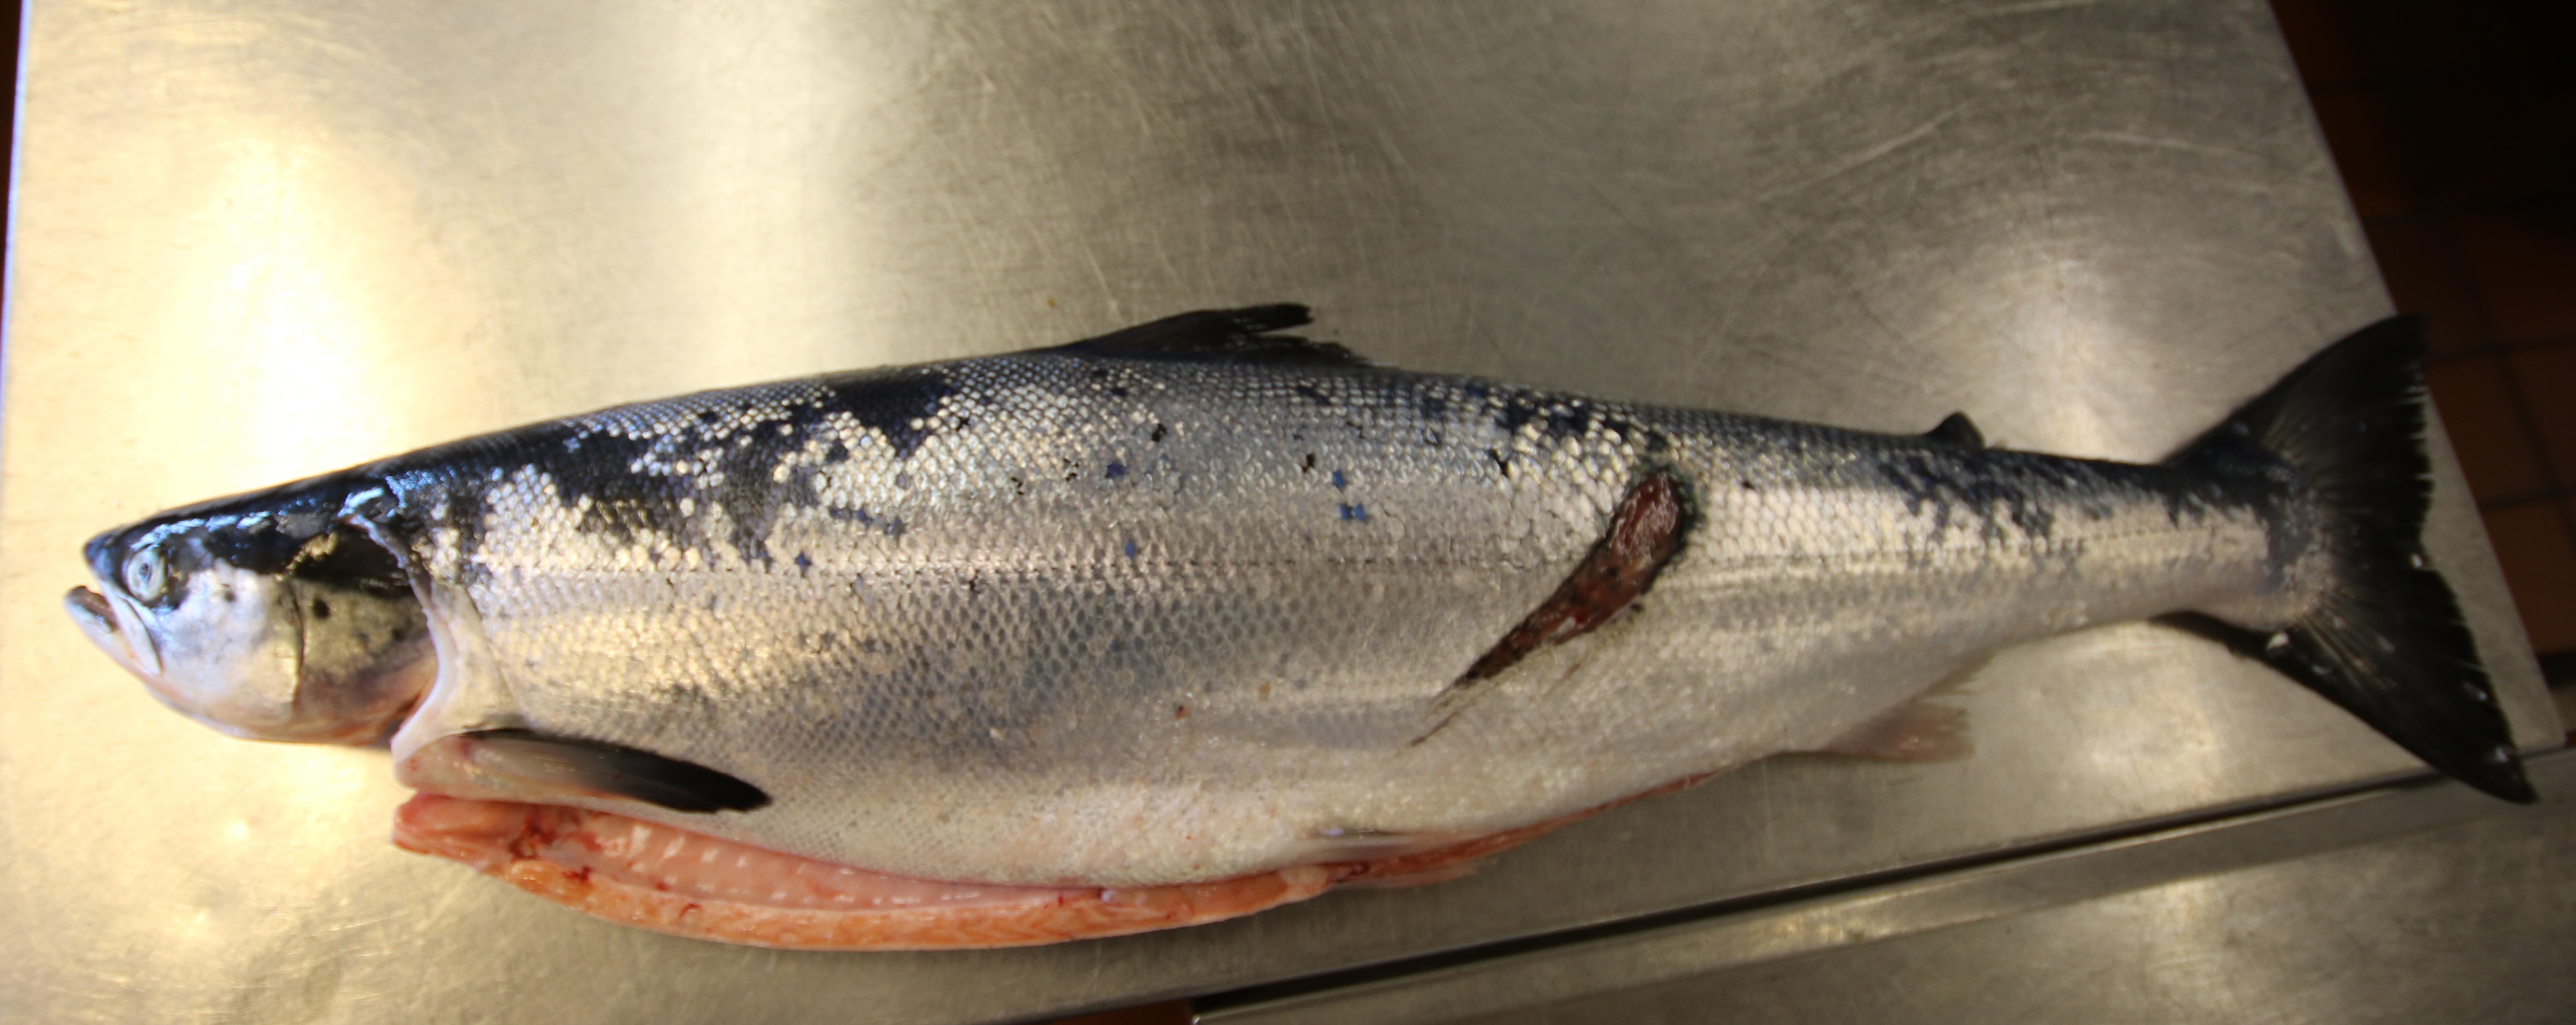
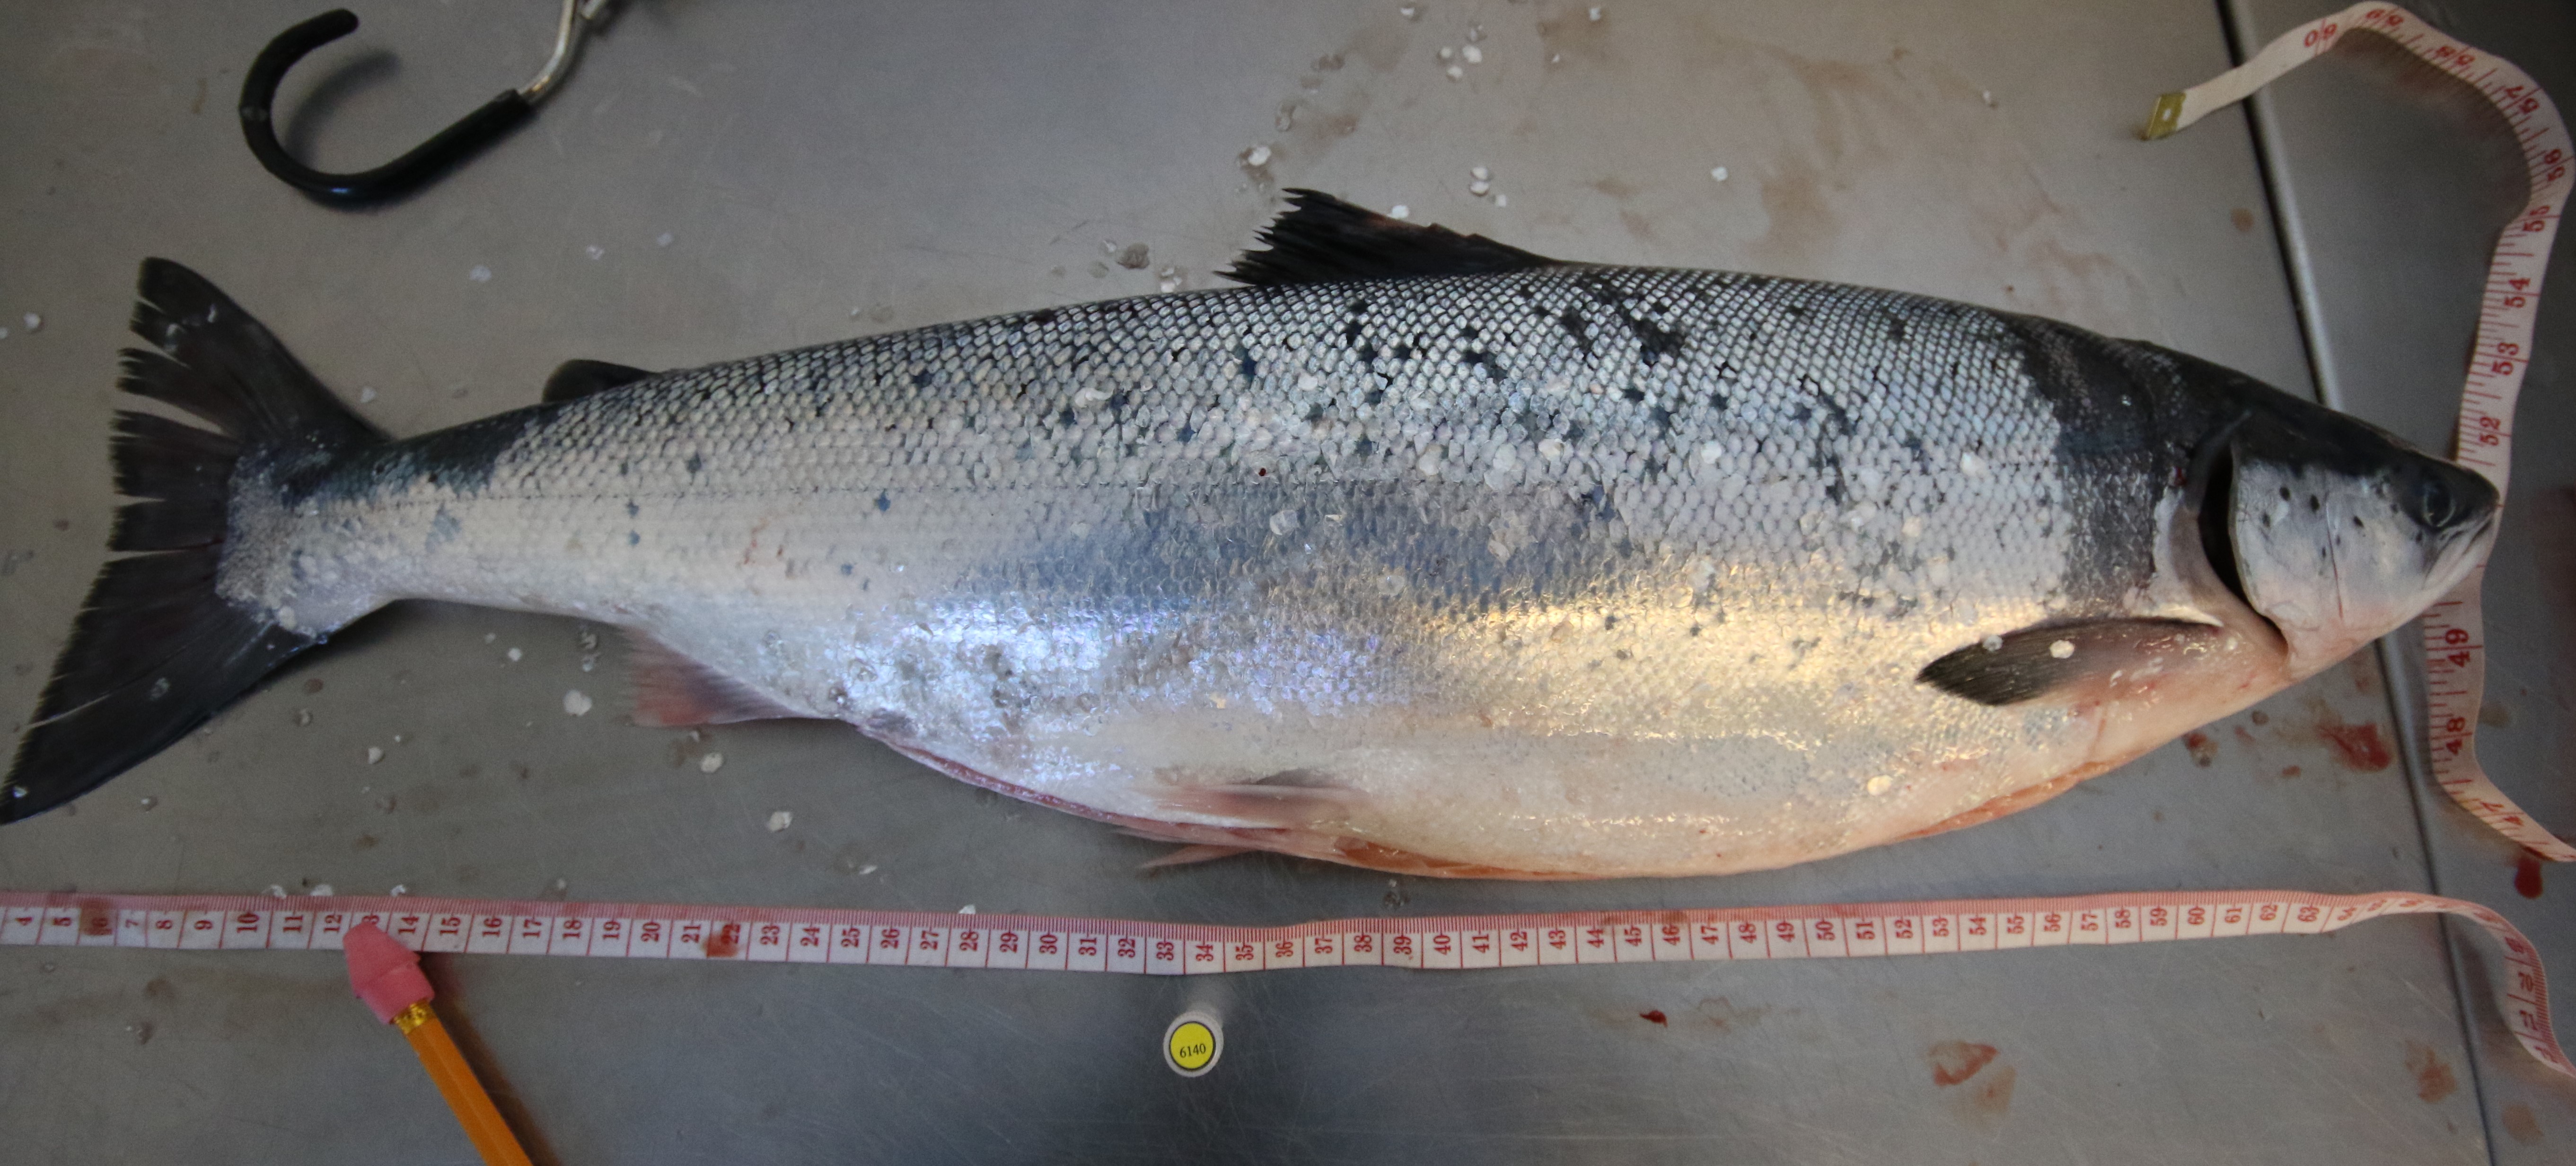
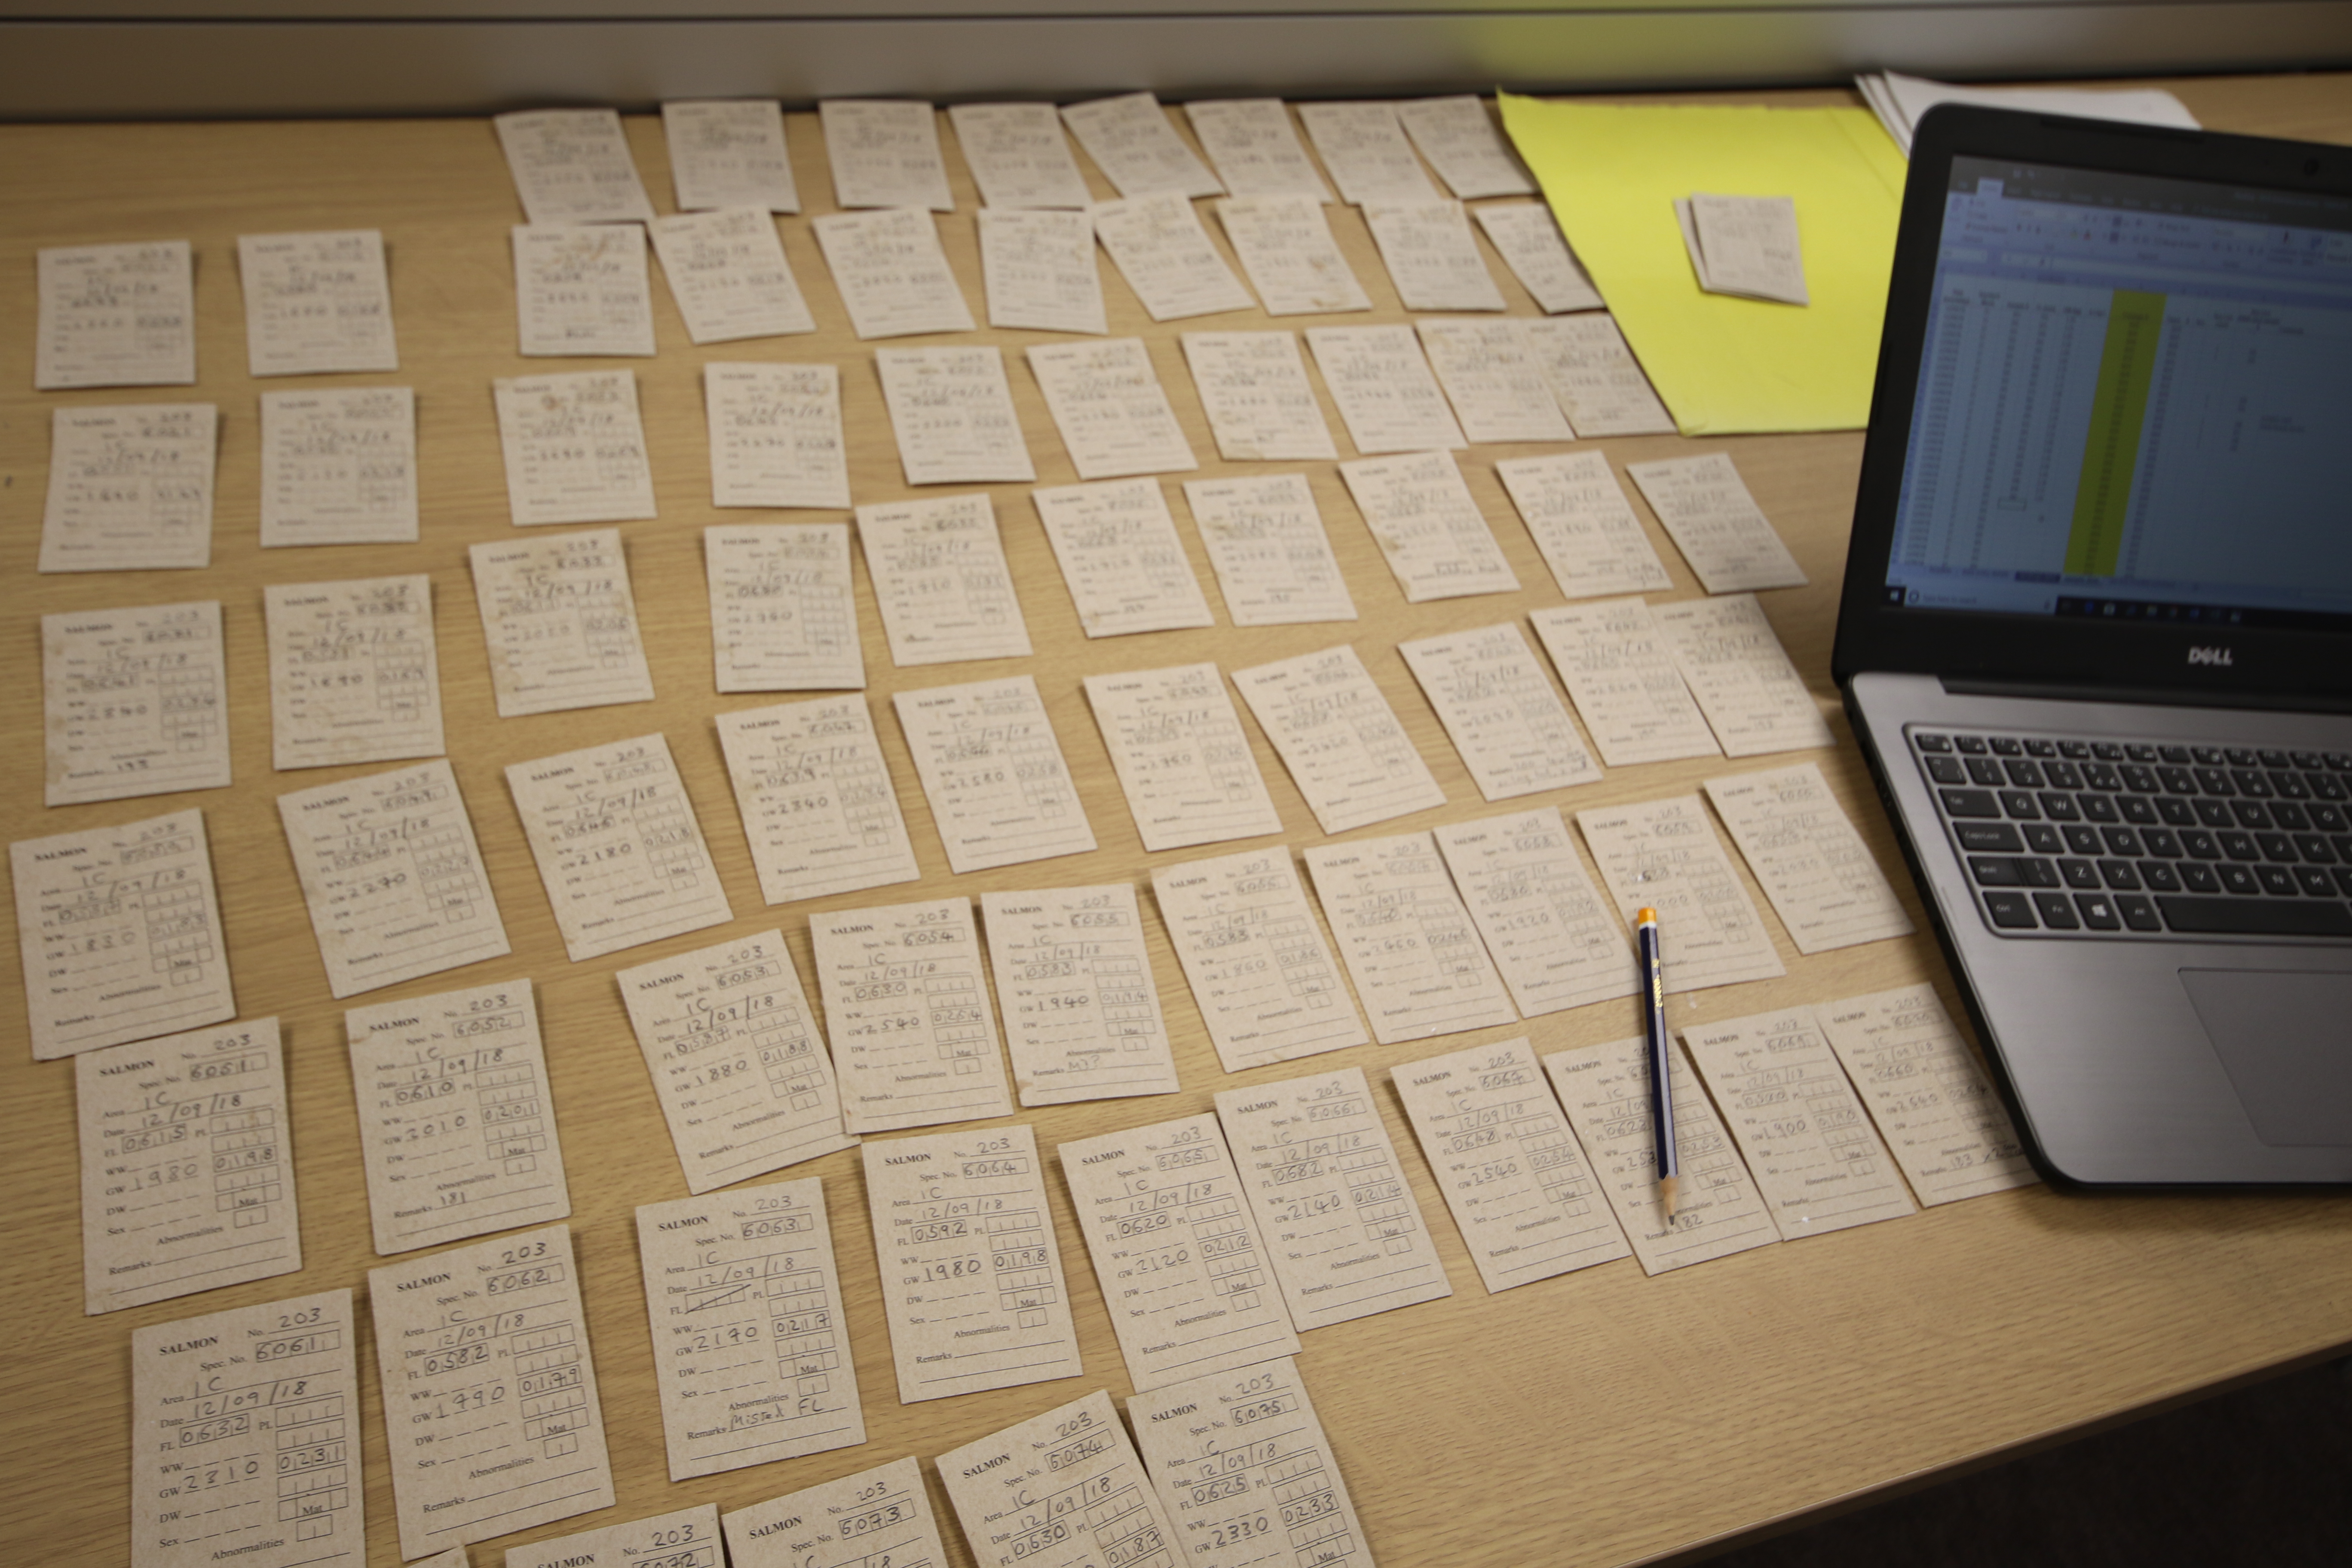
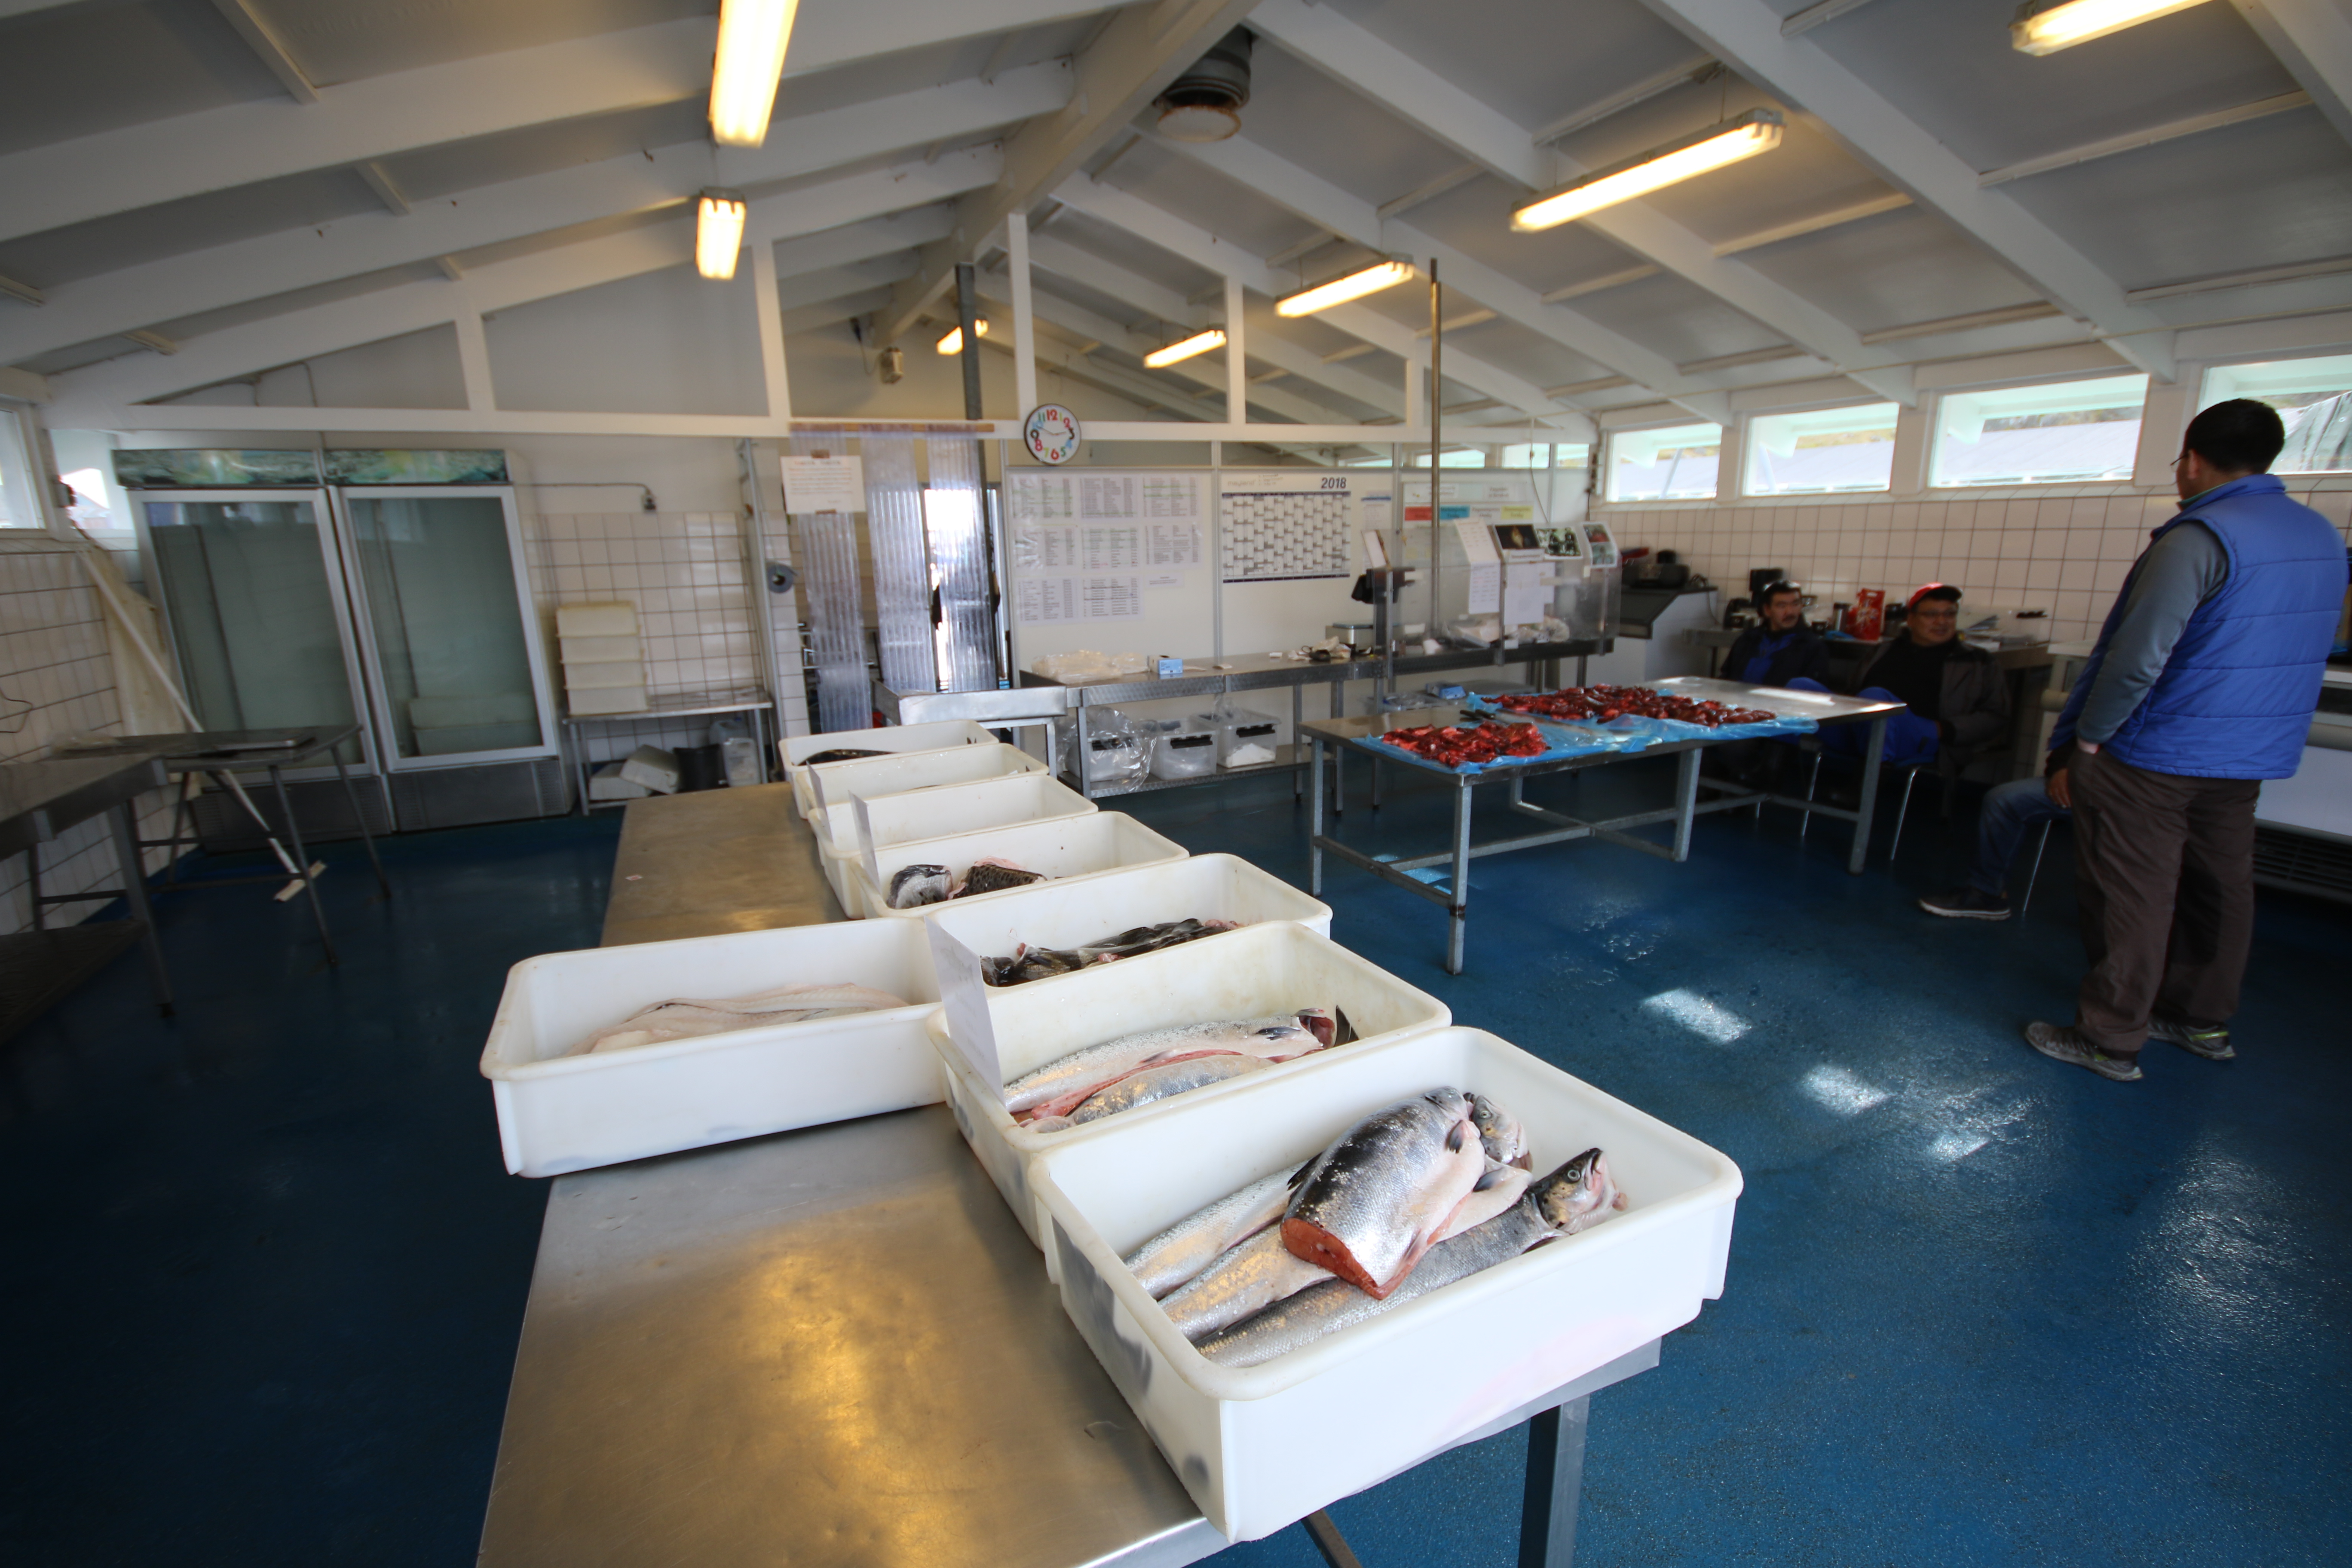
What is sampled?
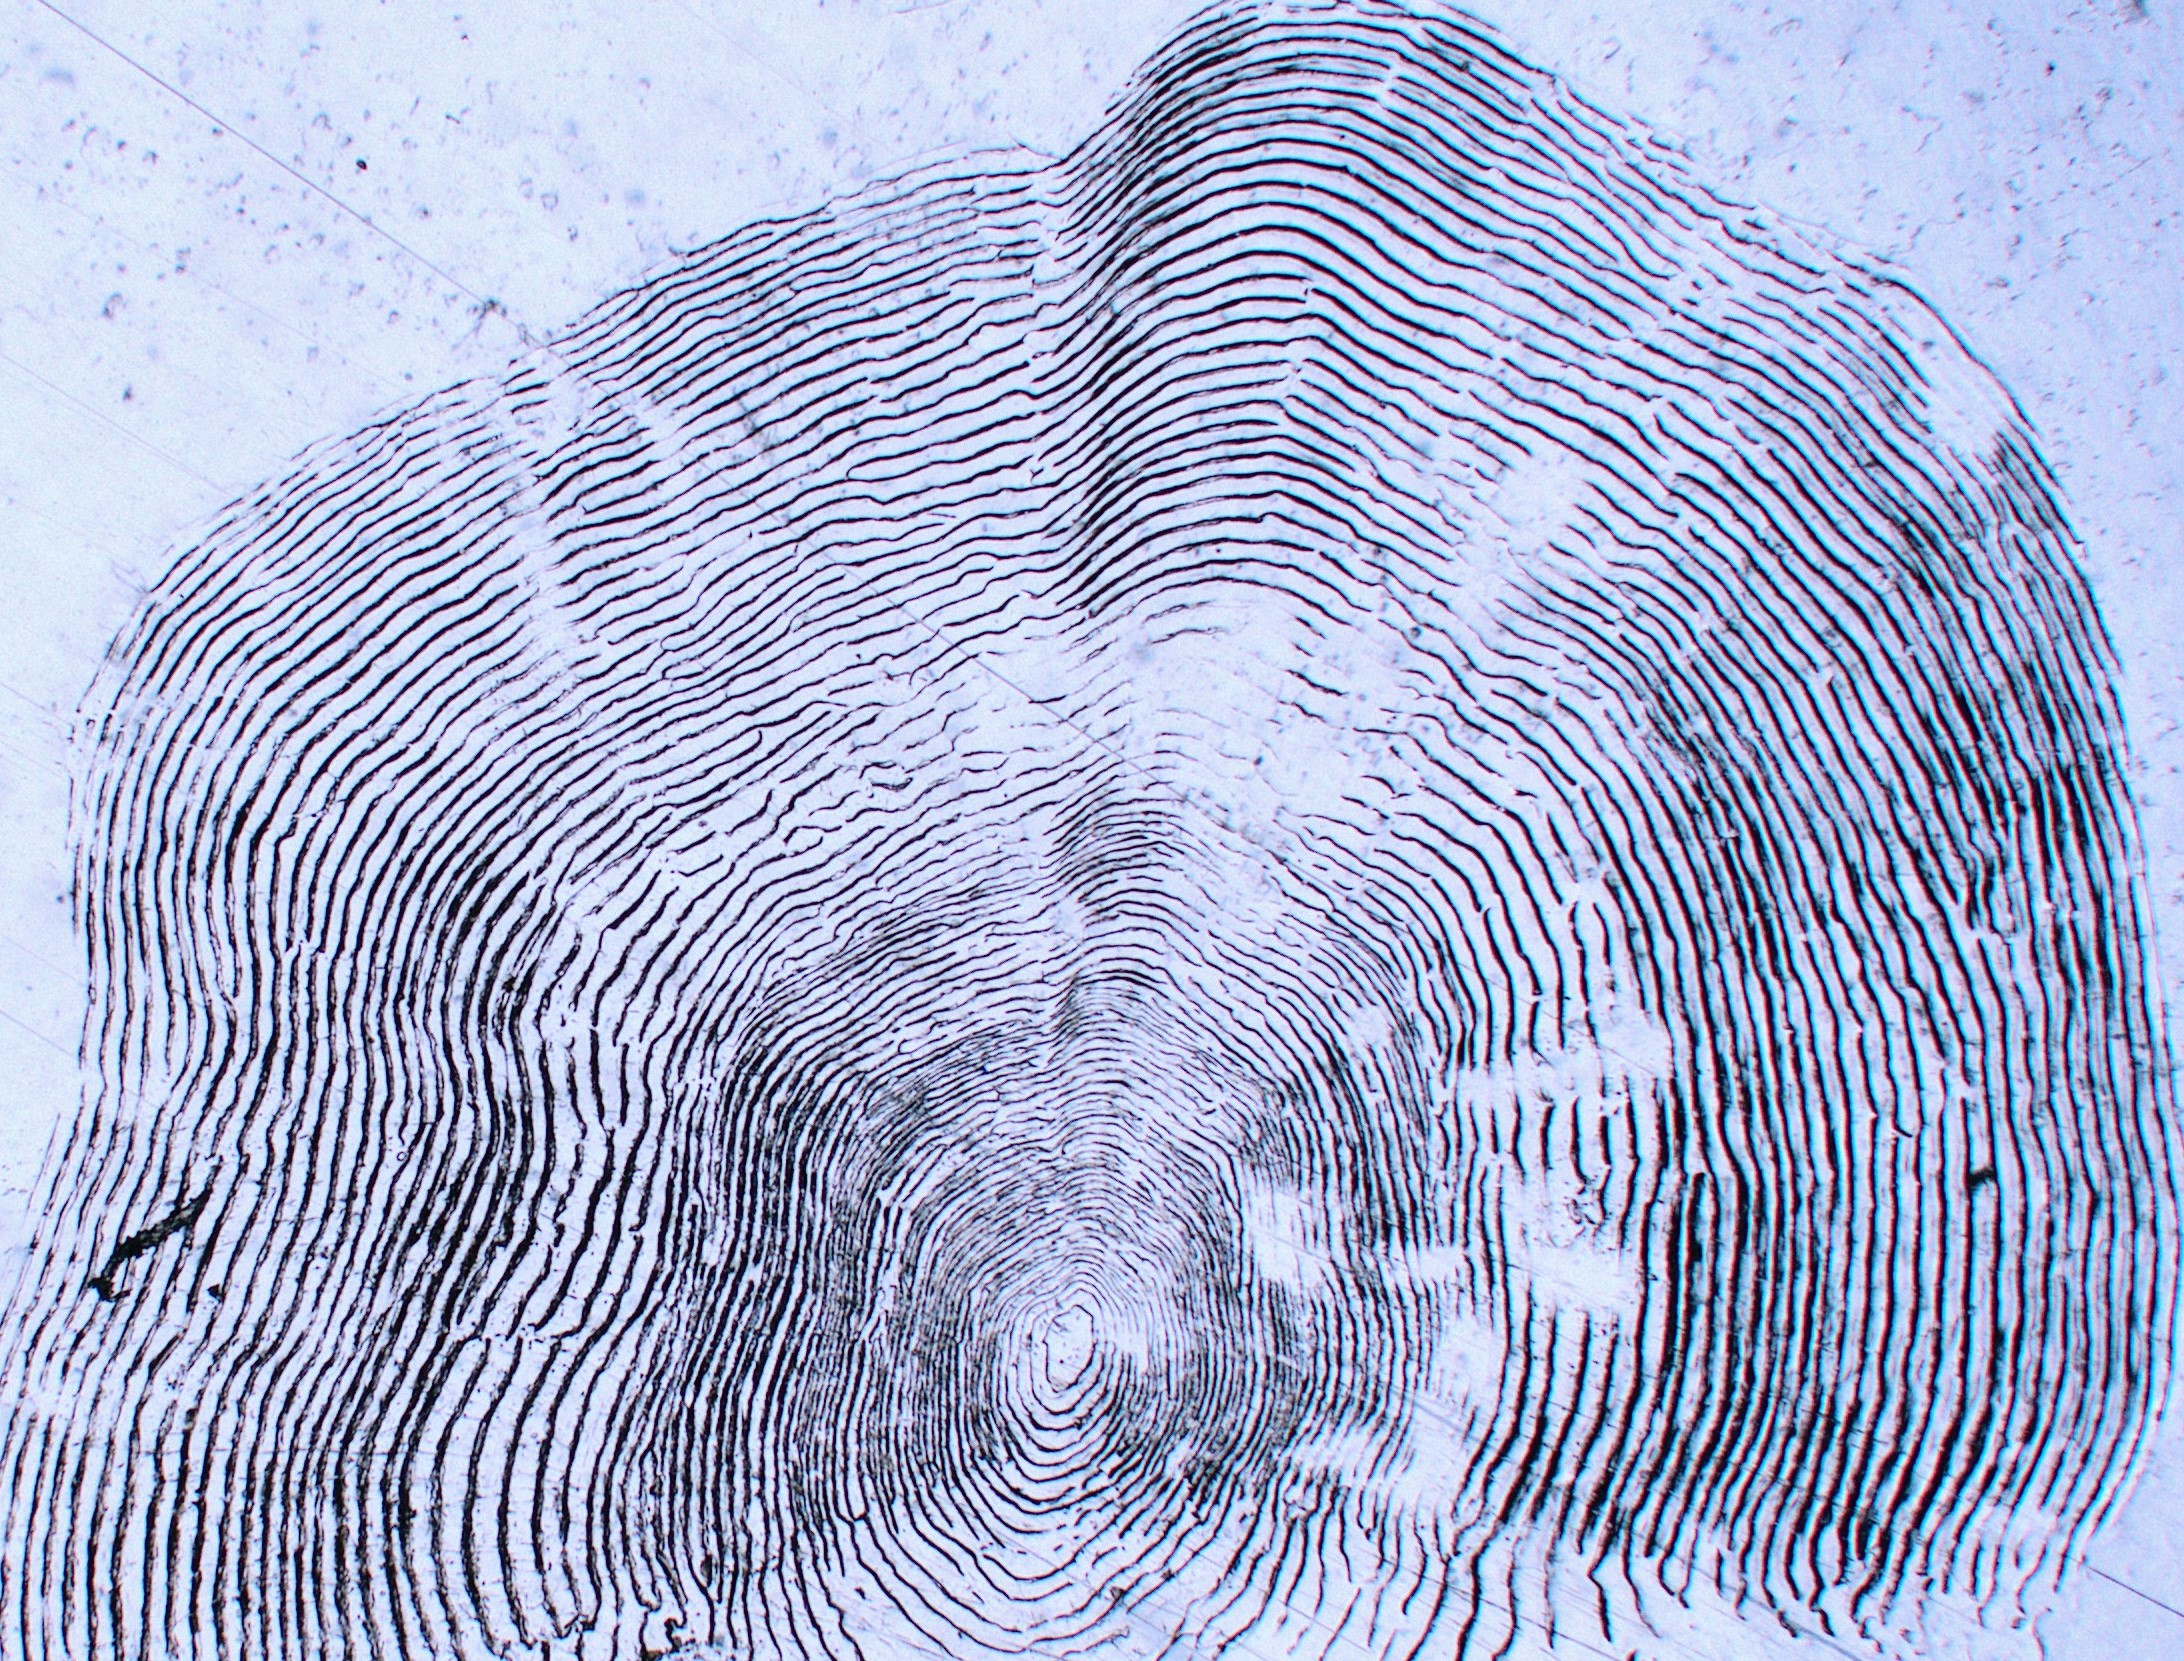
Salmon are sampled opportunistically as they are brought to port from subsistence coastal netting operations. Basic characteristics such as length and weight are taken further to the collection of tissue samples to understand the region of origin through genetics. Scale samples are collected to reveal the individual life history of each salmon (e.g. how many years did it spend in freshwater and at sea, what was the growth rate while at sea?). Sampling in previous years demonstrates that all captures are multi-sea winter salmon meaning that after leaving their home river they will spend more than 1 winter at sea before returning.
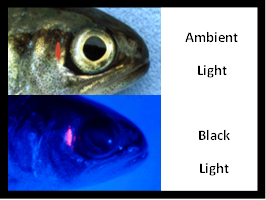
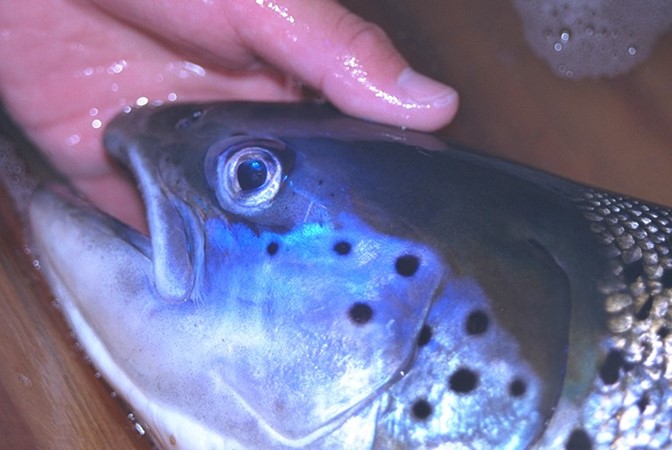
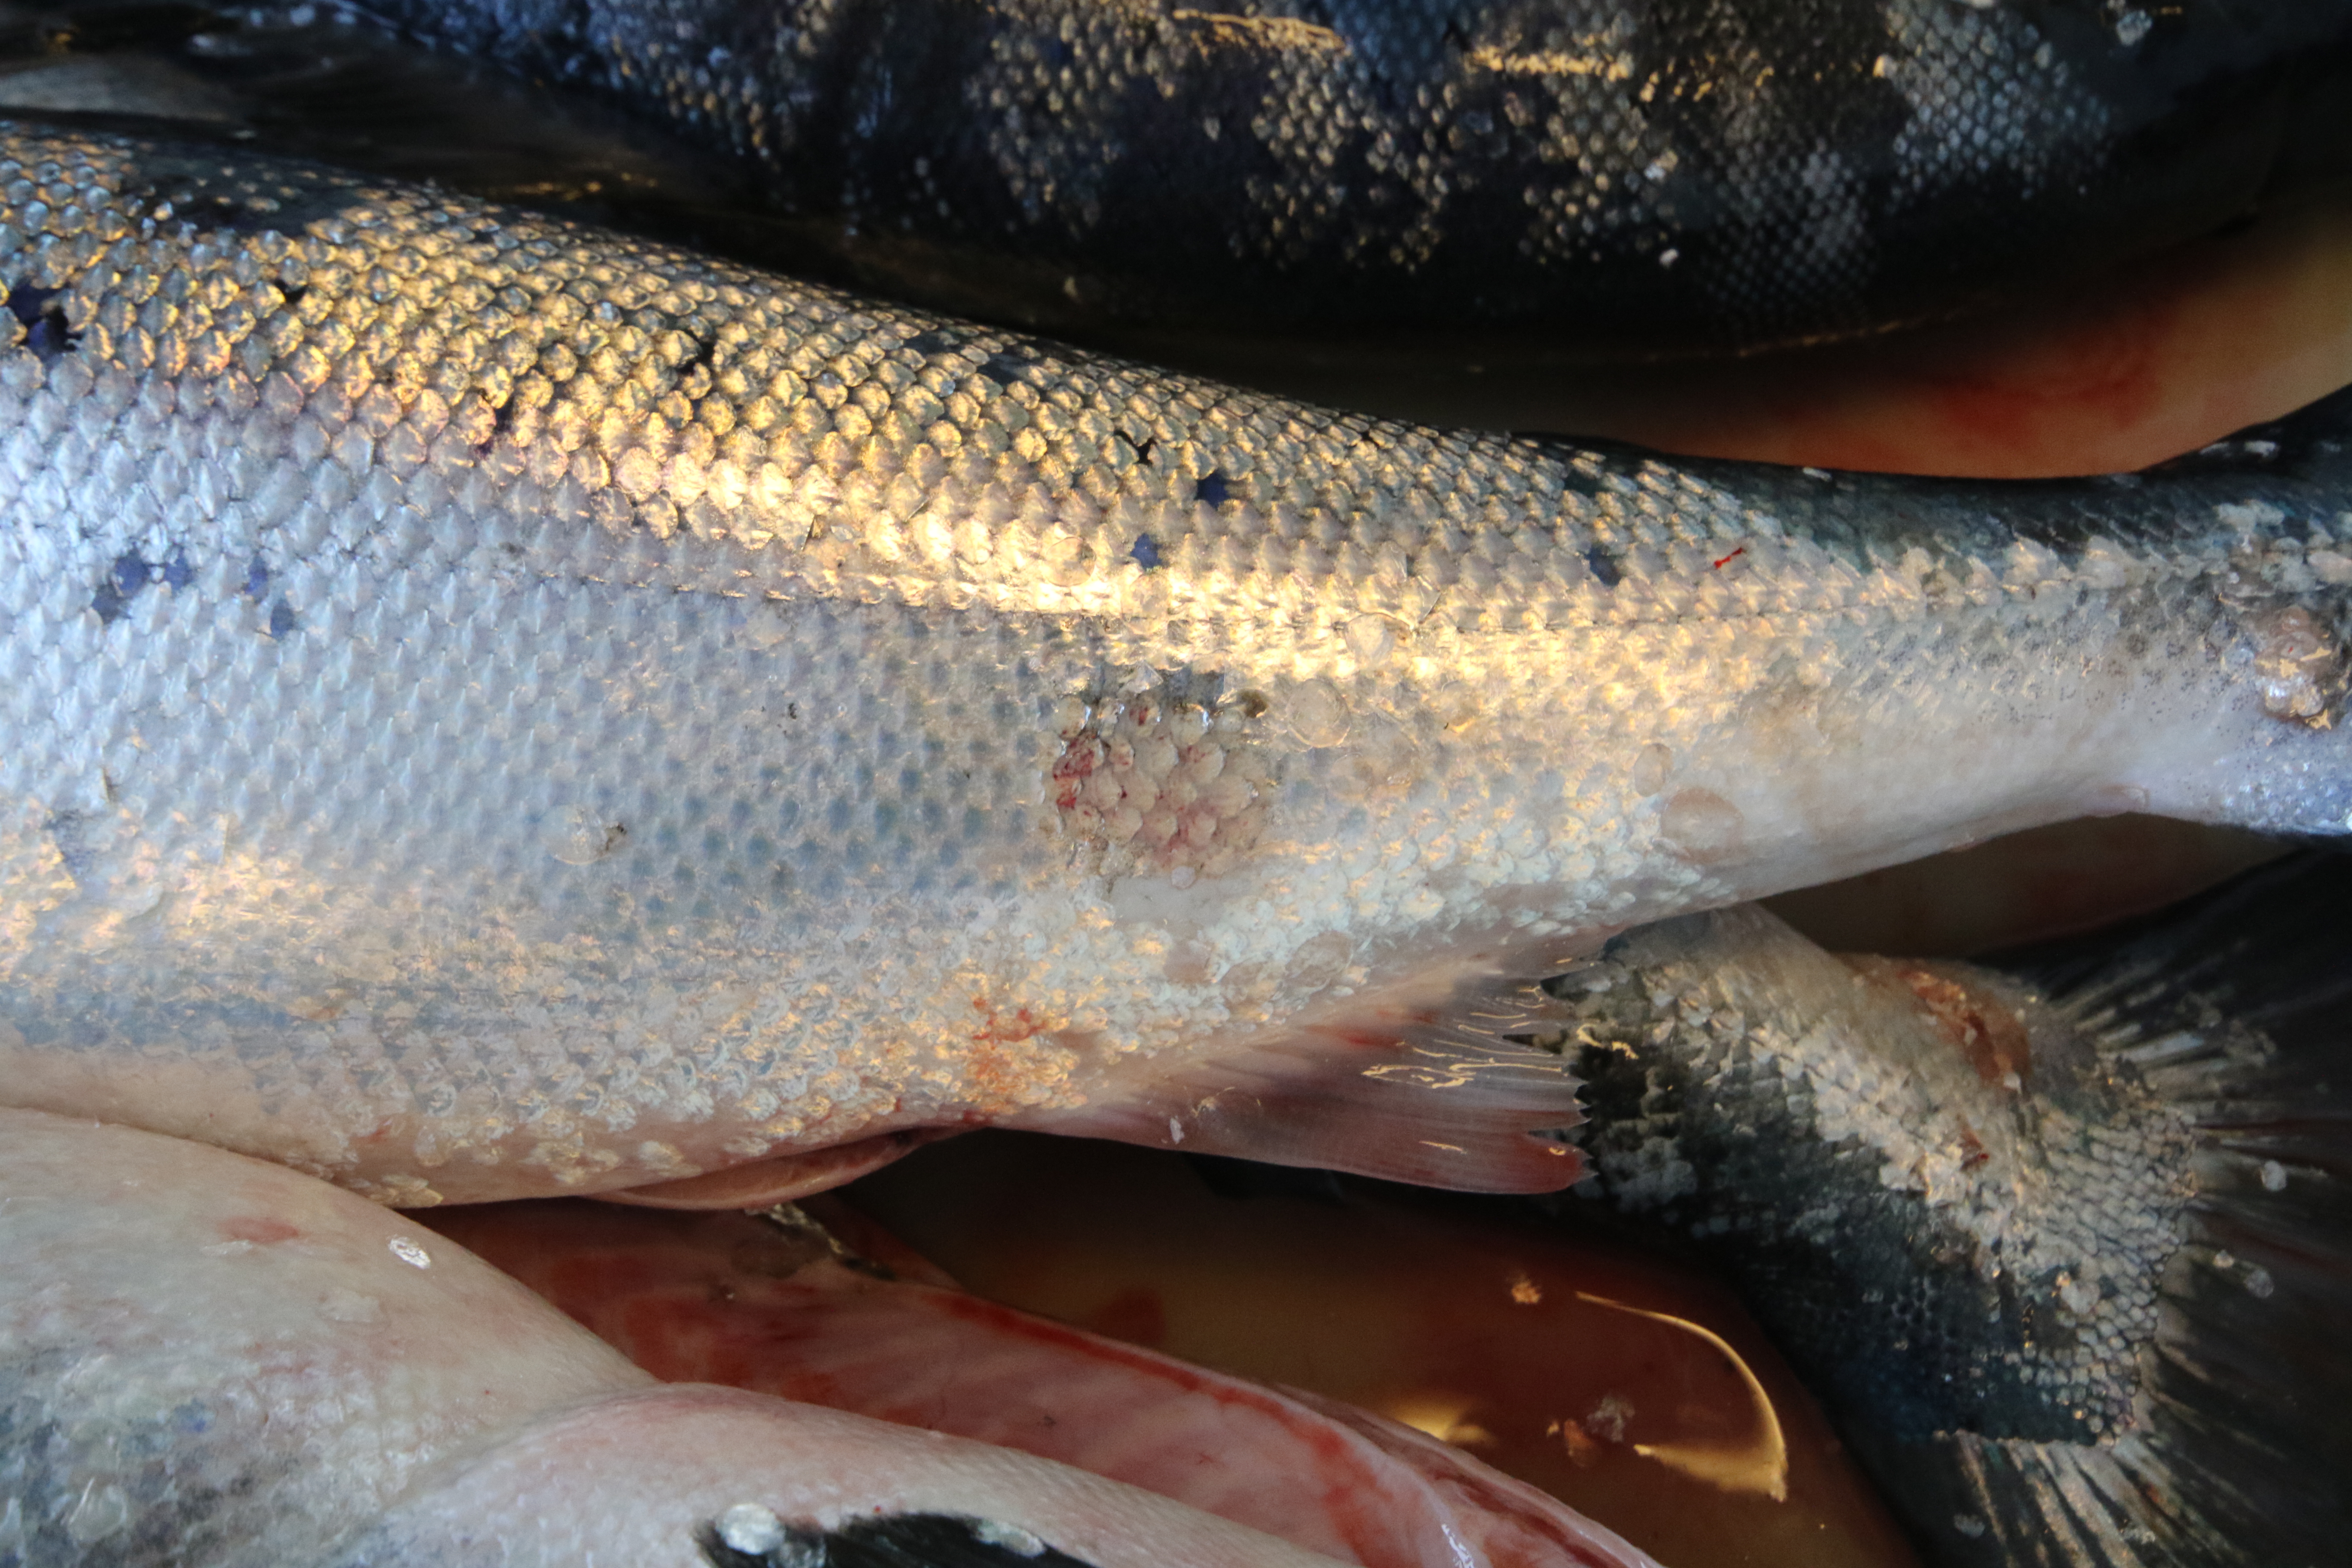
All salmon are also searched for the presence of tags which come in many forms and can be external or internal. If the salmon is adipose fin-clipped then it is extensively searched with magnifying glass and metal detector as this is an indication that a tag could be present. Tagging is still the only way to understand the exact origin of each salmon. However, genetic analysis is rapidly improving and now has the ability to assign a fish to broad geographical regions (e.g. countries) with a high level of precision.
Insights from the data
ICES maintains a database of Greenland tag recoveries with around 6000 records from Canada, France, Faroes, Greenland, Iceland, Ireland, Norway, Spain and all parts of the UK. Analysis show that salmon from Northern Europe have a more easterly distribution within Greenland than fish from southern Europe. Across the West Greenland ports sampled, North American fish were more commonly found in the Northern regions (including Maniitsoq where I am stationed) than European-origin fish (see map below). Based on the time between tagging and capture it is also thought that North American fish take a more direct route to West Greenland than European fish.
Look out for my Flickr photosteam here and my written blogs to hear more of the key insights gained from the data collected here over many years.